

Abstract
The coronavirus disease 2019 (COVID-19) is typically diagnosed by specific assays that detect viral nucleic acid from the upper respiratory tract; however, this may miss infections involving only the lower airways. Computed tomography (CT) has been described as a diagnostic modality in the COVID-19 diagnosis and treatment plan. We present a case series with virologically confirmed COVID-19 pneumonia. Variable CT features were observed: consolidation with ground-glass opacities, ground-glass opacities with subpleural reticular bands, and an anterior-posterior gradient of lung abnormalities resembling that of acute respiratory distress syndrome. Evolution of CT findings was observed in one patient, where there was interval resolution of bilateral lung consolidation with development of bronchiolectasis and subpleural fibrotic bands. While sensitive for detecting lung parenchymal abnormalities in COVID-19 pneumonia, the use of CT for initial diagnosis is discouraged and should be reserved for specific clinical indications. Interpretation of chest CT findings should be correlated with duration of symptoms to better determine the disease stage and aid in patient management.
INTRODUCTION
Reports in December 2019 from Wuhan, Hubei Province, China, of a cluster of patients with severe pneumonia heralded a pandemic that has affected most of the world. As of 31 March 2020, 750,890 confirmed severe acute respiratory syndrome coronavirus 2 (SARS-CoV-2) cases and 36,405 deaths have been reported globally.(1) While extraordinary measures have been taken by many governments in an effort to slow the spread of this virus, over the long term, control of this outbreak will rely on accurate diagnosis and isolation of infected individuals.
Typically, diagnosis of the novel coronavirus disease 2019 (COVID-19) relies on polymerase chain reaction (PCR) of respiratory specimens to detect SARS-CoV-2 nucleic acid. This test is highly specific, but swabs of the upper respiratory tract may lack sensitivity when the infection is confined to the lower airways. Chest computed tomography (CT) has been shown to have a high sensitivity in the Chinese population.(2) The use of chest CT in the diagnosis of COVID-19 was described in February 2020, in the diagnosis and treatment plan for COVID-19 pneumonia issued by the National Health Commission of the People’s Republic of China.(3)
We present a case series of three patients with confirmed COVID-19 pneumonia in our institution, followed by a discussion of the role of chest CT for this novel respiratory tract infection. Informed consent from the patients in this study was waived by the Singapore Ministry of Health, under the Infectious Diseases Act (Chapter 137).
CASE SERIES
Case 1
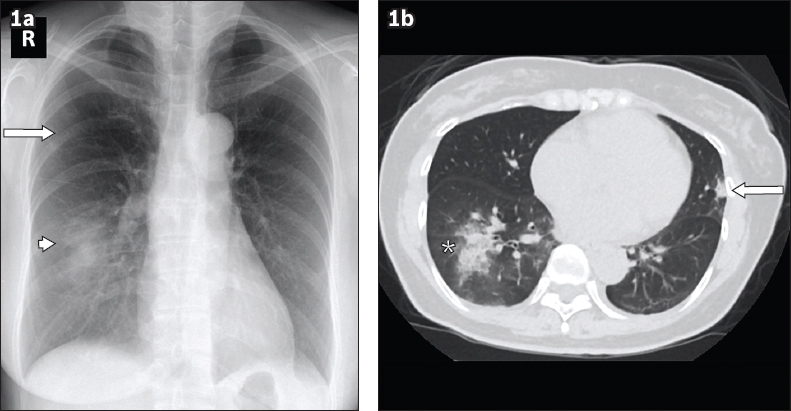
A 52-year-old woman with a background of hypertension presented with cough, shortness of breath and fever for four days. She had no recent travel or contact history. She was admitted for isolation and further management. She was haemodynamically stable and physical examination was unremarkable. Laboratory results revealed mildly elevated C-reactive protein (CRP) of 7.1 mg/L (0.0–5.0 mg/L), while neutrophil level was mildly reduced at 1.43 × 10⁹/L (1.9–6.60 × 10⁹/L). Nasopharyngeal reverse transcription-polymerase chain reaction (RT-PCR) tested positive for SARS-CoV-2. Initial chest radiograph revealed right lower zone consolidation and a faint ground-glass opacity in the right upper zone (
Fig. 1
Case 1: A 52-year-old woman who presented with cough, shortness of breath and fever for four days. (a) Chest radiograph obtained on Day 13 of symptoms shows right lower zone consolidation (arrowhead) and a small focus of ground-glass opacity in the right upper zone (arrow). (b) Axial plain CT image of the lung base obtained on Day 14 of symptoms shows right lower lobe consolidation with surrounding ground-glass opacities (asterisk), a fairly typical appearance in coronavirus disease 2019 pneumonia. A small focus of consolidation is noted in the lingula segment (arrow), which is not discernible on the chest radiograph.
Case 2
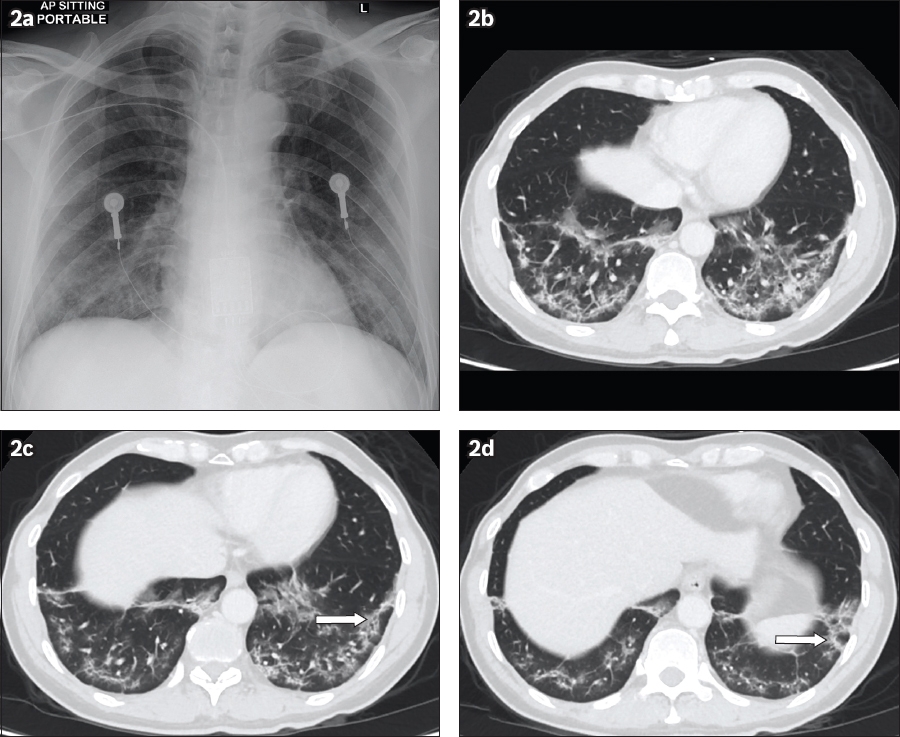
A 56-year-old man from Shandong, China, presented with fever and cough for a week, as well as watery diarrhoea for two days. He had a significant medical history of well-controlled hypertension. Initial physical examination revealed bilateral lower zone crepitations on auscultation. Laboratory results showed elevated CRP of 63.8 mg/L (0.0–5.0 mg/L), lymphopenia of 0.68 × 10⁹/L (1.1–3.10 × 10⁹/L) and elevated lactate dehydrogenase of 796 UL (270–550 UL). Nasopharyngeal RT-PCR was positive for SARS-CoV-2. Chest radiograph, obtained on Day 12 of symptoms, revealed ground-glass opacities in the bilateral lower zones (
Fig. 2
Case 2: A 56-year-old man who presented with fever and cough for a week. (a) Chest radiograph obtained on Day 12 of symptoms shows ground-glass opacities in the bilateral lower lung zones. (b) Axial CT image of the lung base obtained on Day 15 of symptoms shows subpleural reticular bands and ground-glass opacities in the bilateral lower lobes. (c & d) Perilobular opacities were also appreciated in the left lower lobe (arrows).
Case 3
A 71-year-old man with a history of poorly controlled Type 2 diabetes mellitus presented with fever and lethargy for a week. He had no recent travel or contact history. He was febrile at presentation with a temperature of 38.7°C but maintained oxygen saturation of 95% on room air. Auscultation of the lungs revealed coarse crepitations in the right mid to lower zones and left lower zone. Laboratory results revealed an elevated CRP of 138.2 mg/L (0.0–5.0 mg/L), mildly reduced total white blood cell count of 3.5 × 10⁹/L (4.0–9.6 × 10⁹/L) and lymphocyte count of 0.48 × 10⁹/L (1.1–3.1 × 10⁹/L). Nasopharyngeal RT-PCR was positive for SARS-CoV-2. During admission, he had increasing oxygen supplementation requirement, prompting admission to the intensive care unit, where he was intubated and received mechanical ventilation. CT pulmonary angiography was performed to exclude pulmonary embolism as a cause of desaturation. There was multifocal bilateral lung consolidation with diffuse involvement of the lower lobes (
Fig. 3
Case 3: A 71-year-old man who presented with fever and lethargy for a week. CT study was performed on the third week of symptoms. (a) Axial CT images of the lung base in the lung window shows confluent consolidation in the bilateral lower lobes and ground-glass opacities in the bilateral upper lobes with a focal consolidation in the apicoposterior segment of the left upper lobe, layering along the left oblique fissure. (b) Axial CT images of the lung base in the mediastinal window shows bilateral small pleural effusions (arrows), in addition to bilateral lower lobe consolidation. (c) Three-dimensional volume CT image of the lungs shows multifocal bilateral lung consolidation involving the central and peripheral locations, significantly worse in the lower lobes.
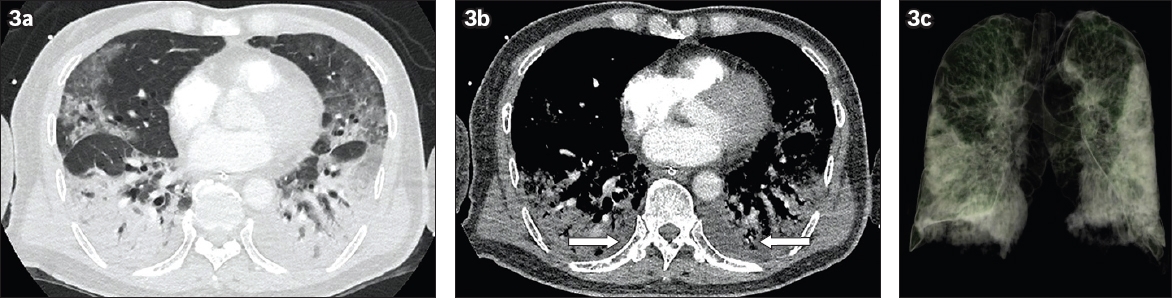
Fig. 4
Case 3: Contrast-enhanced CT images of the (a) right and (b) left lungs in sagittal reconstruction. Chest CT study, obtained on the third week of symptoms, shows anterior-posterior gradient of abnormalities with consolidation affecting the posterior aspects of the bilateral lungs with confluent consolidation seen in both lower lobes and the posterior aspect of the middle lobe. Diffuse ground-glass opacities were noted in the non-dependent areas of the bilateral upper lobes and middle lobe.
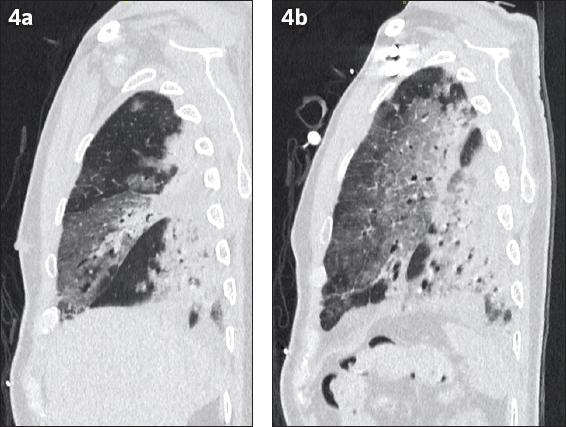
Fig. 5
Case 3: Repeat CT images of the thorax (pulmonary angiography protocol) in (a) axial and (b) coronal planes, performed eight days later, show regression of ground-glass opacities, replaced by organising consolidation and reticular changes. Bronchiolar dilatation was notable in the lower lobes (arrows). Bilateral pleural effusions had grown larger, extending along the pulmonary fissures (arrowheads). The study was negative for pulmonary embolism.
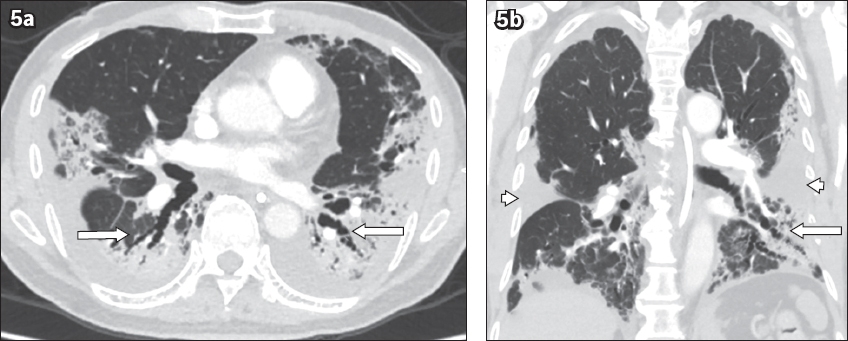
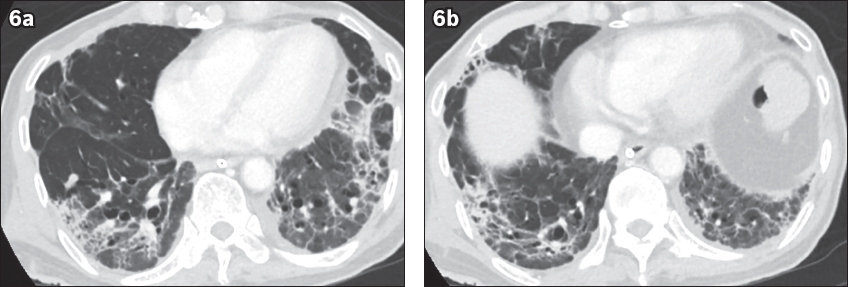
Fig. 6
Case 3: Contrast-enhanced CT images of the lung base, obtained on Week 6 of symptoms (22 days after the initial CT study in
DISCUSSION
A diverse pattern of CT findings in COVID-19 pneumonia has been reported; ground-glass opacities and mixed ground-glass opacities with consolidation are more commonly seen, while other features such as crazy-paving pattern, reverse halo sign, subpleural bands and bronchiectasis have also been described.(4-8) Multifocal bilateral lung involvement, predominantly in the lower lobes and peripheral distribution, was the most common pattern of distribution seen in COVID-19 pneumonia.(4-8) This pattern of multifocal bilateral lower lobe involvement was seen in all three cases in our series. Studies on the evolution of CT findings along the course of the disease showed progression of ground-glass opacities with bilateral lung involvement during the first week of symptoms, which worsens into dense consolidation in the second week.(9,10) Following the second week, as the disease improves, there would be resolution of lung consolidation and development of a reticular pattern, septal thickening and bronchiolectasis, suggestive of fibrosis.(9,10) Patchy ground-glass opacities with subpleural bands in bilateral lower lobes, as seen in Case 2 (
Diffuse lung consolidation, architectural distortion, traction bronchiectasis and pleural effusions have been reported to be more commonly found in severe and fatal disease.(5) These findings were evident in one of our patients (Case 3), who required mechanical ventilation and intensive care support. He developed dense bilateral lung consolidation, patchy ground-glass opacities and bilateral pleural effusions on initial CT study, with follow-up imaging demonstrating development of bronchiolectasis and subpleural bands related to fibrosis. In addition, the presence of an anterior-posterior gradient of lung abnormalities in this patient, with dense consolidation at the dependent regions of the lungs and ground-glass opacities in the non-dependent regions, mirrors the classical CT appearance of the acute (wet) phase of acute respiratory distress syndrome (ARDS).(13) In the late phase of ARDS, a coarse reticular pattern and ground-glass opacification, which were deemed to be fine fibrosis beyond the resolution of CT, had been reported in the non-dependent regions of the lungs.(13) However, these findings were not appreciated on the limited sections of the lung base in this patient. Follow-up chest CT studies may identify the long-term effects of COVID-19 pneumonia with ARDS pattern and determine if fibrotic changes of the lungs are reversible.
Hosseiny et al reported significant overlap in the imaging findings of COVID-19 pneumonia with those of severe acute respiratory syndrome (SARS) and Middle East respiratory syndrome (MERS), where peripheral multifocal air space opacities in the form of ground-glass opacities, consolidation or both, were reported.(14) In addition, other viral pneumonias such as adenovirus, herpes simplex virus and cytomegalovirus may present with bilateral lung consolidation.(15) However, at this time during the pandemic, it is highly unlikely for one to be faced with a situation requiring differentiation of these three pathologies in clinical practice. Instead, emphasis should be placed on the recognition of the pattern of lung parenchymal abnormalities that raises the likelihood of the diagnosis of pneumonia, and the subsequent empirical management of the patient based on the travel or contact history. Specifically, this would involve isolation and contact tracing in the effort to contain the spread of disease. Nevertheless, RT-PCR of respiratory samples remains the reference standard for the diagnosis of COVID-19 infection.
CT has been shown to be more sensitive compared to a chest radiograph, being able to detect ground-glass opacities, which are not discernible on a radiograph.(16) In addition, CT provides valuable information on the degree of severity of pneumonia, which aids in the prognostication of the patient.(5) In spite of these advantages, factors such as increased cost, higher radiation dose and the need for longer breath holds for accurate CT image acquisition compared to chest radiographs should also be considered. Furthermore, strict infection control related to the transfer of patients from the isolation room to the radiology department for a CT study and subsequent decontamination of the CT room following a study needs to be in place.
Several studies have shown that chest CT carries a high sensitivity for the detection of COVID-19 pneumonia.(2,17,18) In a review of 51 patients with COVID-19 pneumonia, the diagnosis of viral pneumonia could be made with chest CT three days prior to positive nucleic acid test results.(18) In addition, nucleic acid test has a limited detection rate for SARS-CoV-2, giving rise to false-negative results, and often requires repeated samples.(2,17) In a large retrospective study of 1,014 patients in Wuhan, China, chest CT carried a true-positive rate of 88% compared to 59% with RT-PCR.(2) In the face of a shortage of PCR test kits and the urgent need for diagnosis despite negative PCR, clinical diagnosis was made based on typical chest CT findings during the peak of the outbreak in Hubei Province, China.(2) This approach may be justifiable in an epidemic area where there is high pre-test probability for the disease, compounded by the limited availability of test kits and laboratory support during the outbreak. However, in our opinion, these results may not be extrapolated to less affected areas with a lower pre-test probability for COVID-19 pneumonia.
In fact, recent recommendations by the American College of Radiology and the British Society of Thoracic Imaging discourage the use of CT as the first-line diagnostic test to diagnose COVID-19, given its untested specificity.(19,20) In our institution, CT is reserved for severe cases where other causes for desaturation such as pulmonary embolism are suspected, or when there is discordance between the clinical and chest radiographic findings. This explains why the CT appearances of pulmonary involvement for our first two cases were derived from abdominal CT.
In conclusion, this case series of three COVID-19 pneumonia patients highlights the variable chest CT features during the acute and convalescent phases. Chest CT is a highly sensitive tool for the delineation of the extent of lung disease, but its use as a first-line diagnostic modality to replace RT-PCR is not certain. Nevertheless, CT can define the extent of pulmonary disease for prognostication and associated complications in patients who suffer from more severe disease. Larger-scale studies with longitudinal follow-up would shed light on the evolution of CT findings and the functional sequelae of COVID-19 pneumonia.