

Abstract
INTRODUCTION
The aim of this study was to assess the reliability and validity of a modified Malaysian version of the Medication Adherence Reasons Scale (MAR-Scale).
METHODS
In this cross-sectional study, the 15-item MAR-Scale was administered to 665 patients with hypertension who attended one of the four government primary healthcare clinics in the Hulu Langat and Klang districts of Selangor, Malaysia, between early December 2012 and end-March 2013. The construct validity was examined in two phases. Phase I consisted of translation of the MAR-Scale from English to Malay, a content validity check by an expert panel, a face validity check via a small preliminary test among patients with hypertension, and exploratory factor analysis (EFA). Phase II involved internal consistency reliability calculations and confirmatory factor analysis (CFA).
RESULTS
EFA verified five existing factors that were previously identified (i.e. issues with medication management, multiple medications, belief in medication, medication availability, and the patient’s forgetfulness and convenience), while CFA extracted four factors (medication availability issues were not extracted). The final modified MAR-Scale model, which had 11 items and a four-factor structure, provided good evidence of convergent and discriminant validities. Cronbach’s alpha coefficient was > 0.7, indicating good internal consistency of the items in the construct. The results suggest that the modified MAR-Scale has good internal consistencies and construct validity.
CONCLUSION
The validated modified MAR-Scale (Malaysian version) was found to be suitable for use among patients with hypertension receiving treatment in primary healthcare settings. However, the comprehensive measurement of other factors that can also lead to non-adherence requires further exploration.
INTRODUCTION
Hypertension is the leading global risk for mortality and is responsible for 13% of deaths worldwide; other risks include tobacco use (9%), high blood glucose (6%), physical inactivity (6%), and obesity and being overweight (5%).(1) Despite the availability of effective antihypertensive medication, only 46% of patients with hypertension achieve optimum blood pressure control; the rest fail to do so due to poor adherence to antihypertensive treatment.(2) Medication adherence is a major concern in healthcare research, especially in the management of chronic conditions, such as hypertension, for which drug treatment is crucial in preventing cardiovascular mortality and morbidity.(3) Poor adherence has been shown to affect blood pressure control negatively.(4)
The 2010 National Health Morbidity Survey reported that the prevalence of individuals with known hypertension in Malaysia was 12.8%;(5) an increasing trend was observed when the results of this survey were compared with those of previous surveys. Among the patients with known hypertension, 78.4% claimed that they were on on oral antihypertensive medications within the past two weeks and 53.2% had sought treatment at government primary healthcare clinics.(4,5) The rate of medication adherence was found to be low among patients with hypertension receiving treatment in primary care settings;(6) A Malaysian study reported a 53.4% adherence rate.(7)
Different tools have been used to evaluate and assess patient adherence to medication, as there is no single gold-standard measurement of patient adherence to medication.(8,9) In developing countries such as Malaysia, information on patient adherence to medication is often derived from self-administered health questionnaires because such research instruments are comprehensive, practical and inexpensive.(9) The most widely used self-reporting measures of medication adherence for hypertension are the Morisky Medication Adherence Scale (MMAS)(10,11) and the Hill-Bone Compliance to Medication Scale.(12) In the MMAS, non-adherence is defined as the intentional or unintentional (e.g. from forgetfulness or carelessness) cessation of medications, whether it is due to the patient feeling better or feeling worse. The Hill-Bone Compliance to Medication Scale addresses the barriers and self-efficacy of patients in their compliance to prescribed medications. In addition to the reasons in the two aforementioned scales, other important reasons for patient non-adherence to antihypertensive medications can be found in the literature. We opine that if more reasons were included, the measure of medication non-adherence would be better able to identify and quantify the contributing factors, and thus improve the measures taken to ameliorate non-adherence.
The aim of the present study was to describe the reliability and construct validity of the Malaysian version of the 15-item Medication Adherence Reasons Scale (MAR-Scale). This study is the first step in the development of the MAR-Scale for use in patients with hypertension in Malaysia. The MAR-Scale was originally developed from a literature review of studies on medication adherence from 1966 to 2002.(13) In that review, the ten most frequently reported reasons for non-adherence were identified. Subsequently, five other frequently reported reasons were identified and added to the MAR-Scale, resulting in the 15-item version.(14,15) In comparison with the MMAS, the MAR-Scale was found to be more effective in identifying non-adherents from adherents.(14)
METHODS
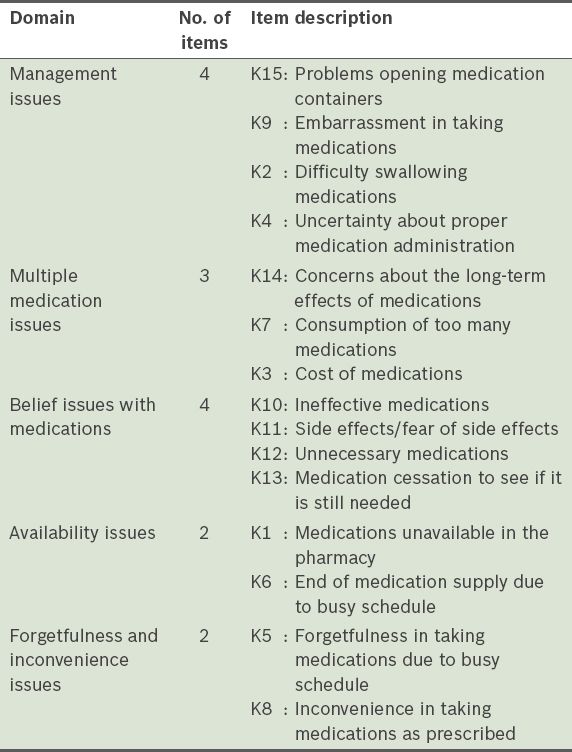
The MAR-Scale consists of five domains and 15 items (
Table I
Description of the 15 items in the Medication Adherence Reasons Scale.
Ethics clearance for the present study was obtained from the Ministry of Health, Malaysia (NMRR-12-625-12500), and the Ethics Committee of University Malaya, Malaysia (Committee/IRB Reference No. 914.5). This cross-sectional validation study was conducted in two phases. Translation of the English version of the MAR-Scale into the Malay language, content validation of the translated Malay version by an expert panel, face validation via a preliminary test among a small group of patients with hypertension and exploratory factor analysis (EFA) were conducted in Phase I. Confirmatory factor analysis (CFA) and internal consistency reliability calculations were carried out in Phase II. EFA was done to show the underlying structures, while CFA was done to confirm whether the items adequately measured the underlying concept.(17) The sample size used for EFA and CFA was based on Comrey and Lee’s ‘very good to excellent’ category, which stated that there must be at least 10–15 subjects per item.(18)
In Phase I, the original English version of the MAR-Scale was translated into Malay, the official language of Malaysia (this translated version will hereafter be referred to as the Malaysian version of the MAR-Scale). Translation was done independently by two bilingual persons – a graduate school teacher and a public health specialist. Backward translation of the Malaysian version into the English language was undertaken by two bilingual public health specialists. The specialists were blinded to the original English version of the MAR-Scale.
Content validity of the scale was assessed to examine whether the items in the scale were representative of the reasons for non-adherence to antihypertensive medication. This was done with the help of three experts – a family medical specialist, an internal medicine specialist and a public health specialist. They ensured that the Malaysian version of the MAR-Scale retained the same meaning as the original. A pilot test on patients with hypertension was also conducted to assess the face validity of the Malaysian version, in terms of clarity of language and the time taken to complete the questionnaire. Following these evaluations, all 15 items included in the questionnaire were found to be suitable, relevant and important.
The specially developed 15-item questionnaire was then administered to four government primary healthcare clinics in the Hulu Langat (Bangi and Semenyih Health Clinics) and Klang (Meru and Kapar Health Clinics) districts in Selangor, Malaysia. These clinics serve patients ranging from those with a low-income socioeconomic status to those with an affluent, middle-income socioeconomic status. Between December 2012 and end-March 2013, patients with hypertension who were waiting for their appointments at the chronic diseases clinics were approached with information sheets and informed consent forms. The inclusion criteria were as follows: (a) had a diagnosis of essential hypertension for at least six months; (b) of Malaysian nationality; (c) aged above 18 years; and (d) able to read and understand the English and Malay languages. Patients who agreed to participate in the study were given the self-administered questionnaire, which takes about 15 minutes to complete. Out of the 220 patients with hypertension approached in Phase I, 185 participated in EFA. For CFA in Phase II, 480 of the 580 patients with hypertension who were approached participated in the study.
Analyses were performed using IBM SPSS Statistics version 19 (IBM Corp, Armonk, NY, USA) and IBM SPSS Amos version 21 (IBM Corp, Armonk, NY, USA). Descriptive analyses were performed to obtain the frequencies, proportions, means and standard deviations. Estimation maximisation methods were used to determine missing values. To check for multivariate outliers and to test whether values were missing completely at random (MCAR), Roderick JA Little’s chi-square statistic was used.(19,20) This test reveals a nonsignificant p-value that is MCAR, i.e. the ‘missingness’ does not depend on the values of the variables in the data set that is being analysed.(17,21) Mahalanobis distance was used to remove multivariate outliers prior to analysis.(17)
RESULTS
The overall response rate in the present validation study was 83.1% (
Table II
Data on the administration of the Medication Adherence Reasons Scale (Malaysian version) in health clinics.
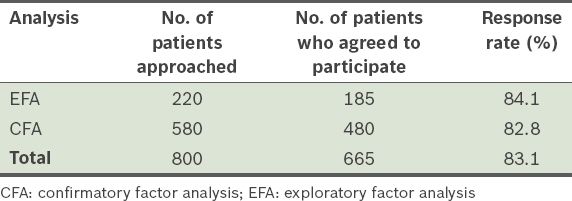
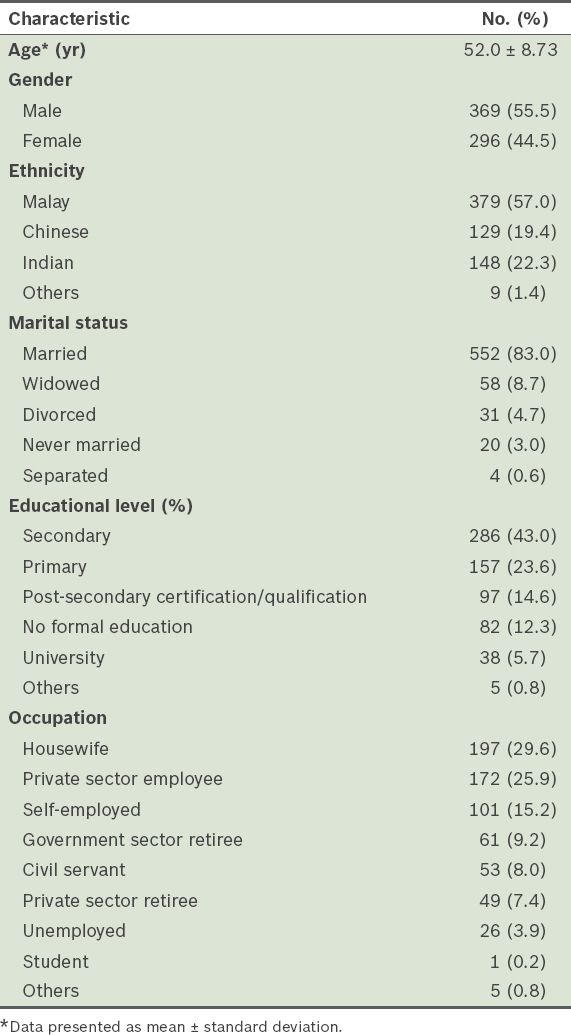
Table III
Demographic data of the respondents (n = 665).
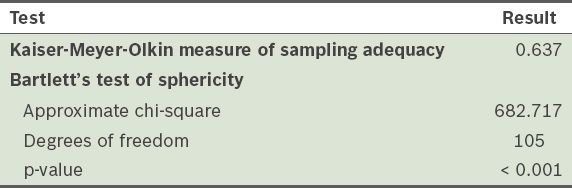
A total of 185 respondents were involved in EFA. To justify performing the factor analysis, Bartlett’s test of sphericity and Kaiser-Meyer-Olkin (KMO) test were done to determine whether there were sufficient significant correlations among the items.
Table IV
Results of Bartlett’s test of sphericity and Kaiser-Meyer-Olkin test for the 15-item correlation matrix.
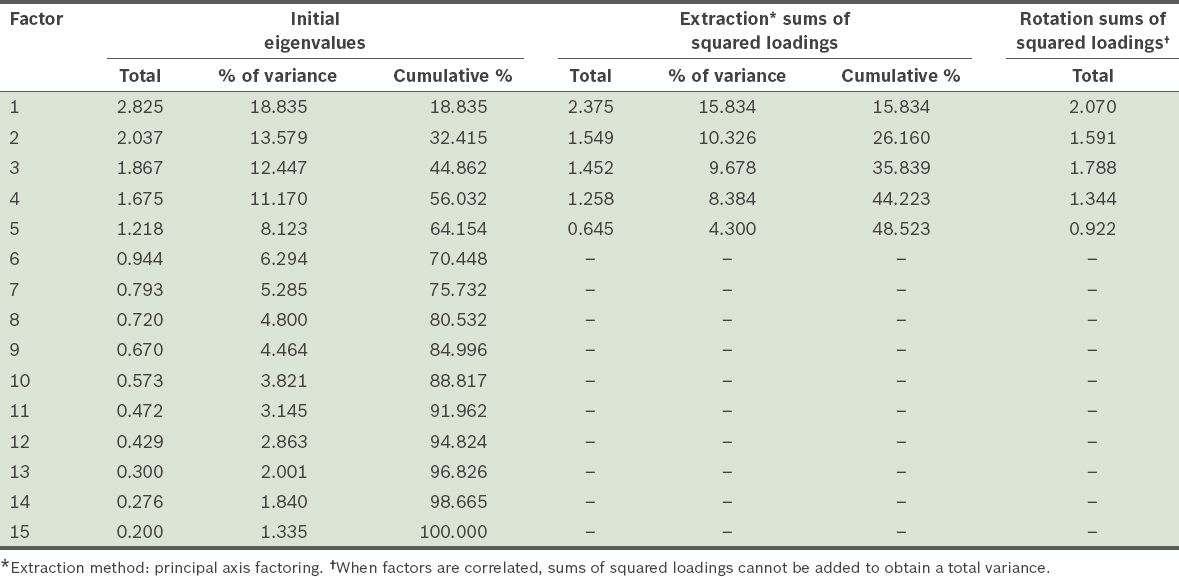
The number of initial factors was determined via principal axis factoring (PAF), examination of the communalities, eigenanalysis and examination of the scree plot. PAF, rather than principal component analysis (PCA), was used as an extraction method because the former provides a better estimate of the correlations; PAF includes errors of measurement, while PCA does not separate errors of measurement from shared variance.(24) Oblique rotation, namely direct oblimin, was used as the rotation method because this method assumes that the factors are correlated. Although orthogonal rotations often produce simple solutions, these rotations rest on the critical assumption that the factors, or subscales of interest, are uncorrelated with one another; this assumption is rarely met in healthcare research. Pedhazur et al(25) argued that orthogonal solutions are unrealistic portrayals of sociobehavioural phenomena and that the assumption that factors might be correlated is a reasonable one in health sciences. This is because although the dimensions that are dealt with in health sciences are often conceptually different, they are, nevertheless, correlated dimensions of a construct.(23)
The item communalities, or the total amount of variance among the 15 items that can be explained by the extracted factors, are presented in
Table V
Communalities in the 15 items of the Medication Adherence Reasons Scale (Malaysian version).
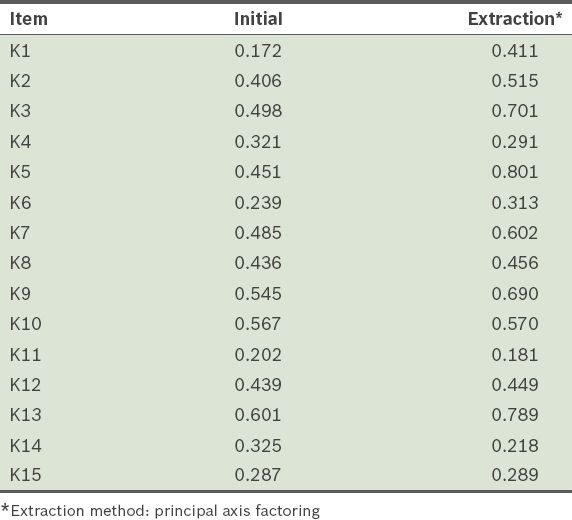
Table VI
Total variance explained by principal axis factoring of the 15 items in the Medication Adherence Reasons Scale (Malaysian version).
In the scree plot (
Fig. 1
Scree plot shows the eigenvalues plotted against their principal components. A straight line was drawn through the smaller eigenvalues where a departure from the line occurred.
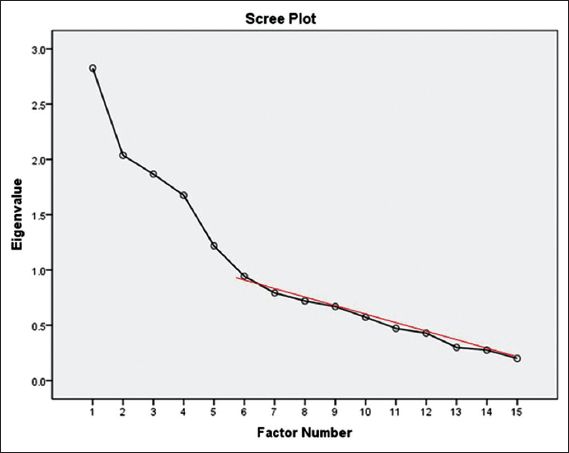
Table VII
Pattern matrix of the 15 items of the Medication Adherence Reasons Scale (Malaysian version) showing items with low loadings, namely K11 and K14.
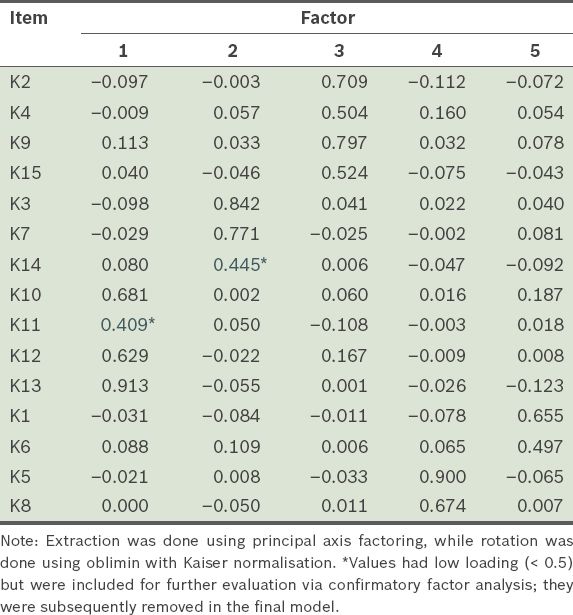
Table VIII
Principle axis factoring followed by direct oblimin rotation factor loadings of the questionnaire (n = 185).
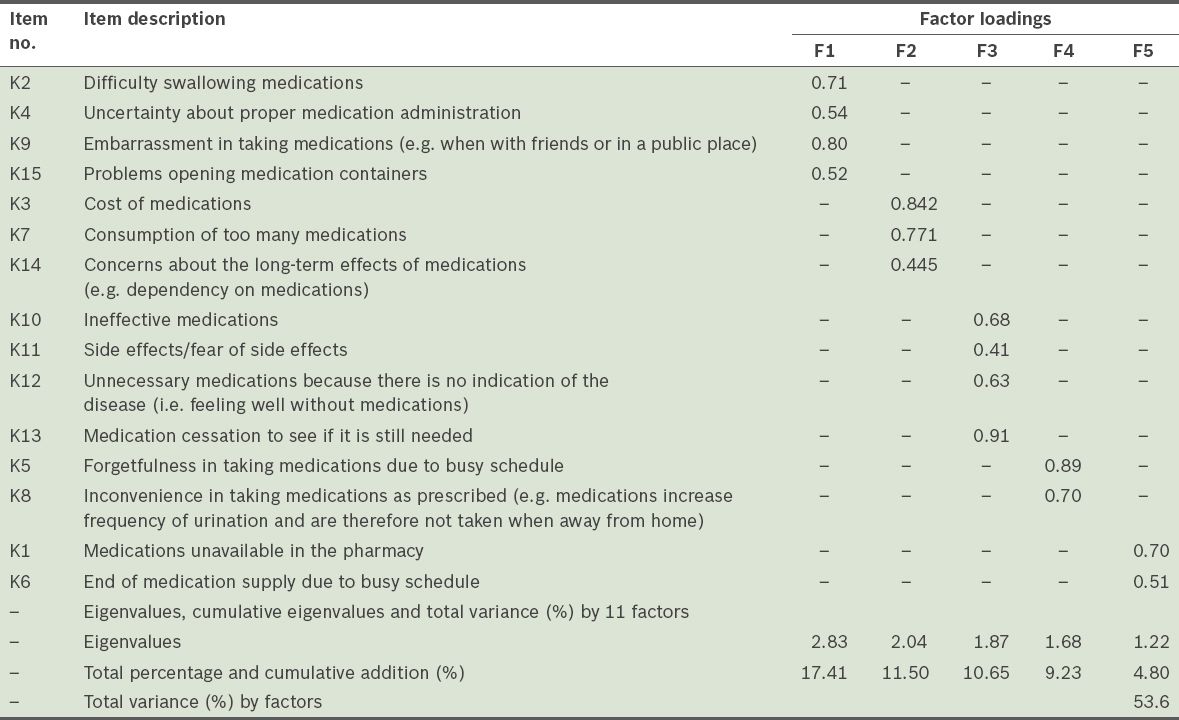
Table IX
Total variance explained with 11 items.
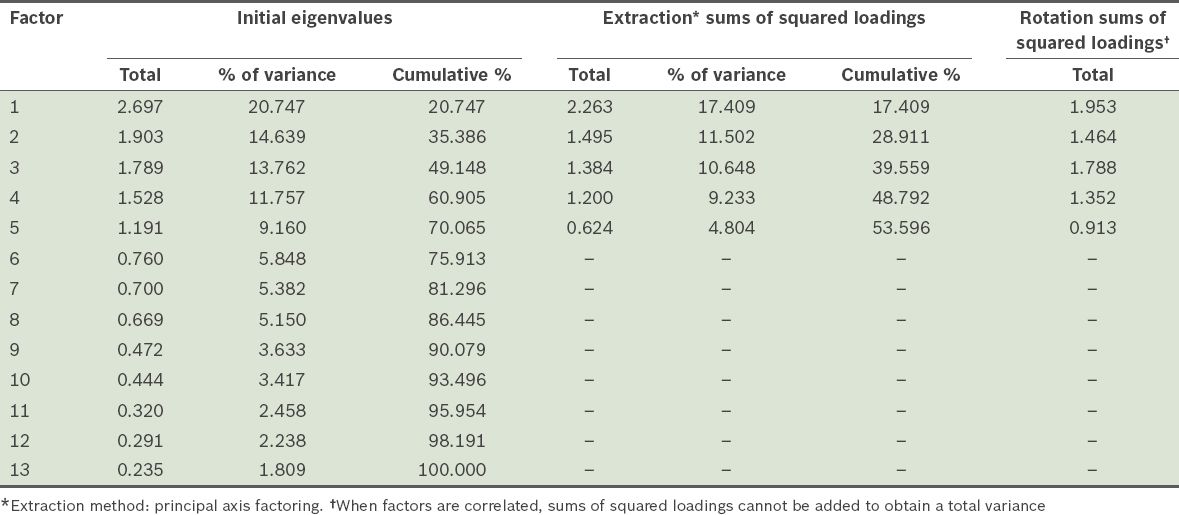
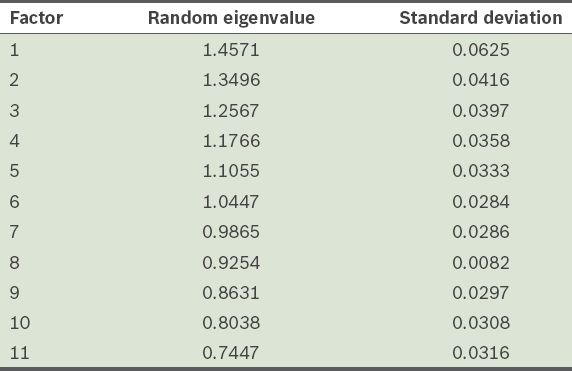
Table X
Distribution of eigenvalues retained from Horn’s parallel analysis.
In Phase II, the test-retest reliability was evaluated using the intraclass correlation coefficient (ICC) in a sample of 31 patients. ICC was used instead of kappa because the former is a better measure for evaluating data within ratings based on some type of scale,(32) as was the case in this study. ICC values above 0.7 are considered to be an indicator of good reliability. The ICC values for the five subscales (factors) of the Malaysian version of the MAR-Scale ranged between 0.51 and 0.90 (management issues: 0.90; multiple medication issues: 0.70; belief issues with the medication: 0.72; availability issues: 0.51; forgetfulness and convenience issues: 0.78), indicating an ‘acceptable to good’ level of agreement across the four measurements (namely management issues, multiple medication issues, belief issues with the medication, and forgetfulness and convenience issues). However, there was less agreement for the fifth factor (i.e. availability issues). The internal consistency of each factor was calculated using Cronbach’s alpha. The overall Cronbach’s alpha value was 0.78 and the average values of the five subscales ranged between 0.50 and 0.83. Only four factors (management issues, multiple medication issues, belief issues with the medication, and forgetfulness and convenience issues) were internally consistent; availability issues was not. It was noted at this stage that availability issues should be removed due to low internal consistency reliabilities, pending confirmation via CFA.
For CFA, a separate sample of 480 patients completed the questionnaire and factor analysis was performed to assess model fitness. A combination of several fit indices were used to assess the model as no agreement on a single gold standard measure exists.(17) As recommended, various fit indices including relative chi-square (χ2/degree of freedom [df]), comparative fit index (CFI), goodness-of-fit index (GFI), adjusted goodness-of-fit index (AGFI), Tucker-Lewis index (TLI), root mean square error of approximation (RMSEA) and standardised root mean square residual were used. It is generally accepted that a χ2:df ratio < 3; CFI, GFI, AGFI and TLI values > 0.90; and RMSEA ≤ 0.07 indicate adequate model fitness.(17) Modification index coefficients were used to check any cross-loadings between items. Model modifications were based on values of the Akaike information criterion for comparing different models.(33) A preliminary model is shown in
Fig. 2
Factor structure of the preliminary model of the Medication Adherence Reasons Scale (Malaysian version) using confirmatory factor analysis. AGFI: adjusted goodness-of-fit index; AI: availability issues; BI: belief issues with medications; CFI: comparative fit index; df: degrees of freedom; FC: forgetfulness and convenience issues; GFI: goodness-of-fit index; MI: management issues; MM: multiple medication issues; RMSEA: root mean square error of approximation; TLI: Tucker-Lewis index
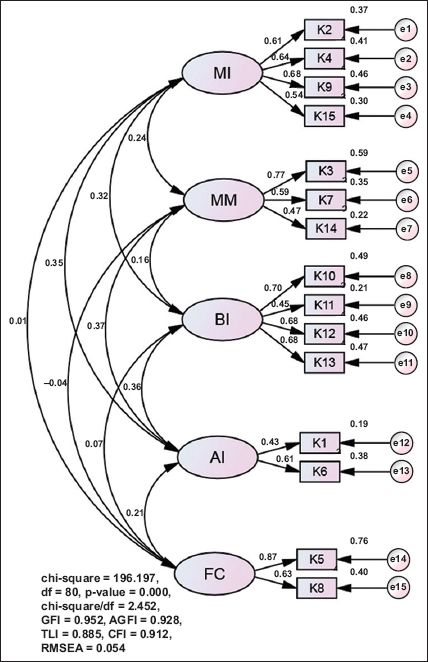
Fig. 3
Factor structure of the final model of the Medication Adherence Reasons Scale (Malaysian version) using confirmatory factor analysis. AGFI: adjusted goodness-of-fit index; AI: availability issues; BI: belief issues with medications; CFI: comparative fit index; df: degrees of freedom; FC: forgetfulness and convenience issues; GFI: goodness-of-fit index; MI: management issues; MM: multiple medication issues; RMSEA: root mean square error of approximation; TLI: Tucker-Lewis index
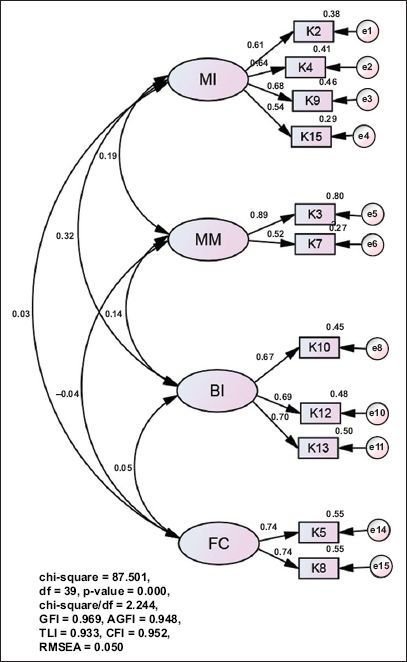
The model was cross-validated with 1,000 bootstrap resample, which yielded a Bollen-Stine p-value of 0.064 (i.e. > 0.05), indicating that the model was valid. The model also demonstrated convergent validity with standardised loadings of > 0.5. The average variance extracted (AVE) values for the four factors were near 0.5 and the composite reliability was 0.7. Between the respective constructs, the AVE values were greater than the R-squared values, indicating sufficient discriminant validity.(17)
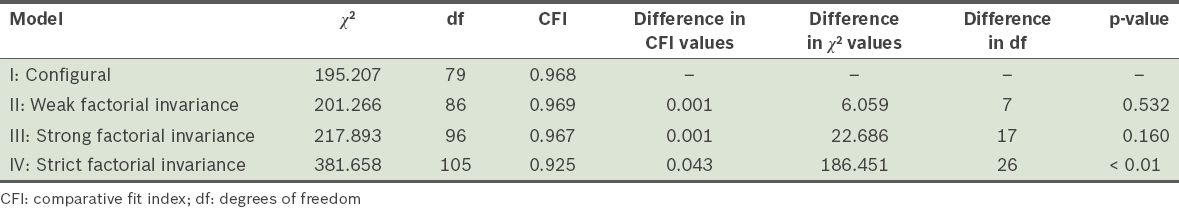
Multi-group analysis was done and factorial invariance was examined to test whether the items in the Malaysian version of the MAR-Scale can be used equivalently across different populations (e.g. with different ethnicity and gender proportions). The degree to which tests or inventories measure a construct in an equivalent fashion, across different groups, was determined.(34) As proposed by Cheung and Rensvold,(35) a difference in CFI value of < 0.01 and a p-value > 0.05 were taken to indicate that factorial invariance was present. The Malaysian version of the MAR-Scale was found to demonstrate sufficient factorial invariance across gender (
Table XI
Factorial invariance across gender.
DISCUSSION
The results of the present study demonstrated that 11 of the 15 items of the MAR-Scale (Malaysian version) had good reliability and construct validity among patients with hypertension from government primary healthcare clinics in Selangor, Malaysia. As the study only included patients with hypertension who were treated in government primary healthcare clinics, the findings cannot be generalised to the entire hypertensive population in Malaysia. The results obtained may be due to characteristics unique to patients with hypertension who were treated and had follow-ups in government primary healthcare clinics.(36) Nonetheless, the findings of the study may serve as a basis for future studies that wish to compare patients with hypertension attending government primary healthcare clinics with those attending private primary healthcare clinics.
Factorial validation from the present study confirmed a four-factor structure instead of the original five. This may be due to the different background and culture of the study population. The findings of our study suggest that patients with hypertension face issues such as medication management, multiple medications, belief in medication, forgetfulness and inconvenience. The results are consistent with those of previous studies conducted in other developing countries.(37) In our study, medication availability issues were not found to be a reason for non-adherence, which is similar to that observed in another study conducted in Malaysia. The study reported that poor blood pressure control was not due to medication availability issues or a lack of therapeutic regimens.(38)
The present study has several strengths. Four methods of validation were utilised and four primary health clinics in two districts were assessed. The sample size for CFA was large and the overall response rate was good. The findings of this study provide initial evidence of the face and content validities, test-retest and internal consistency reliabilities and construct validity of the Malaysian version of the MAR-Scale. Moreover, to the best of our knowledge, the present study is the only validated study conducted among patients with hypertension in Malaysia to understand reasons for non-adherence. However, in the exploratory factorial validation, it is important to note that not all individual measures of sampling adequacy were above 0.6;(23) although the values of items K3 (i.e. cost of medications; 0.47), K7 (i.e. consumption of too many medications; 0.49), K5 (i.e. forgetfulness in taking medications due to busy schedule; 0.47) and K8 (i.e. inconvenience in taking medications as prescribed; 0.45) were not above 0.6, these items were not dropped in the statistical analysis. This is because removing too many items would affect the factor structure of the scale (there would have been too few items left for CFA).
The multi-group analysis results demonstrate sufficient factorial invariance across gender and ethnicity. Further validation studies that compare these factorial validation methods (e.g. EFA and CFA) with other methods such as the Rasch analysis may be beneficial, because the latter method separates respondent and item properties to ensure that each validated item accounts for each participant’s background and level of literacy. Further studies evaluating the use of the Malaysian version of the MAR-Scale in patients with other chronic diseases (e.g. diabetes mellitus and asthma) could be done.
It should be noted that although items might be observed to be statistically significant in the present study, some of these items might be clinically nonsignificant. For example, although side effects/fear of side effects and concerns about the long-term effects of the medications were found to be important reasons for non-adherence in the literature, these two items were excluded from our study. Further qualitative studies may be needed to explore whether each item is an important reason for non-adherence in the present study’s group of patients with hypertension. In the future, if more items are found to be associated with non-adherence, they may be added to the scale so that it will be better able to identify, quantify and explain the reasons for non-adherence. The items in the scale should also have been tested for predictive validity with regard to blood pressure control, as was done for the self-reported MMAS.(11)
The present validation study is an important step in the development of a new tool for measuring self-reported antihypertensive medication non-adherence. It is a clinically meaningful scale that can be used by healthcare providers to measure non-adherence and to identify the reasons for non-adherence. The information derived from the use of this scale can help healthcare providers better understand the reasons for non-adherence among patients with hypertension attending government primary healthcare clinics in Malaysia. With this better understanding, healthcare providers will be better equipped to develop more efficient interventions to promote adherence.
In conclusion, the findings of the present study indicate that the modified scale (i.e. the Malaysian version of the MAR-Scale) is suitable for use and that it is a valuable four-factor, 11-item tool for measuring reasons for non-adherence to antihypertensive medication in primary healthcare settings. However, the comprehensive measurement of other factors that can also lead to non-adherence requires further exploration.
ACKNOWLEDGEMENTS
We would like to thank the Director General of Health, Malaysia, for granting us permission to publish this study. We also like to thank Dr Elizaberth Jisha Unni, Department of Pharmaceutical Sciences, University of Southern Nevada, USA, for giving us permission to use the original MAR-Scale. Our thanks also goes out to Prof Karuthan Chinna, Department of Social and Preventive Medicine, University of Malaya, for his valuable input and guidance on the statistical aspects of this research, and Dr Hanif bin Zailani, District Health Officer, Hulu Langat District Health Office, Ministry of Health, for his assistance.