

Abstract
A 68-year-old woman with poorly controlled diabetes mellitus presented to the emergency department with choreoathetoid movements affecting the upper and lower left limbs. Computed tomography of the brain did not show any intracranial abnormalities. However, subsequent magnetic resonance (MR) imaging of the brain revealed an increased T1 signal in the right basal ganglia, raising the suspicion of nonketotic hyperglycaemic chorea-hemiballismus. Management consisted of adjusting her insulin dose to achieve good glycaemic control. The patient subsequently recovered and was discharged after eight days. There are many causes of basal ganglia T1 hyperintensity, including hyperglycaemia in patients with poorly controlled diabetes mellitus. This case emphasises the importance of MR imaging in the early diagnosis of hyperglycaemia as a cause of chorea-hemiballismus, to enable early treatment and a better clinical outcome.
CASE PRESENTATION
A 68-year-old diabetic Malay woman presented to the emergency department with choreoathetoid movements that initially affected the upper left limb and subsequently progressed to the lower left limb over three days. This was not associated with any other neurological symptoms such as slurring of speech, limb weakness or numbness. Clinical examination revealed upper and lower left limb choreoathetoid movements with no limb weakness, facial asymmetry, nystagmus or other cerebellar signs. Her venous blood glucose level was elevated at 23.3 mmol/L. Unenhanced computed tomography (CT) of the brain (
Fig. 1
(a) Axial CT, (b) axial T1-W, (c) T2-W and (d) diffusion-weighted MR images
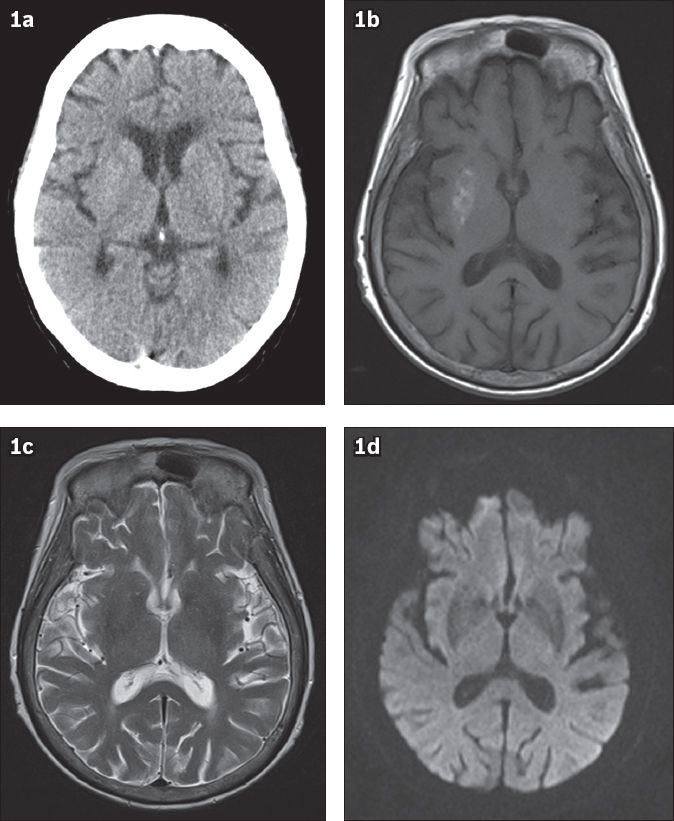
IMAGE INTERPRETATION
Unenhanced axial CT images do not show any intracranial haemorrhage or infarction, nor any change specific to the basal ganglia (
DIAGNOSIS
Nonketotic hyperglycaemic chorea-hemiballismus.
CLINICAL COURSE
The patient was admitted and referred to a neurologist for further management. Oral risperidone and lorazepam were prescribed. Her Mixtard® dose was adjusted to 18 U in the morning and 11 U at night, and good glycaemic control was achieved; her blood sugar level was 7.4 mmol/L. The patient’s choreoathetoid movements eventually resolved over eight days and she was subsequently discharged. During her five month follow-up, the patient’s blood sugar level was 19.1 mmol/L and her Mixtard dose was further increased to 28 U in the morning and 18 U at night. She did not have any further episodes of choreoathetoid movement.
DISCUSSION
The terms ‘hemiballism’ and ‘hemichorea’ are often used interchangeably and refer to continuous, nonpatterned, involuntary movements involving one side of the body. Some authors have suggested differentiating the two hyperkinetic movement disorders based on aetiology, pathology and severity. However, the difference seems to be more phenomenological than pathophysiological. Hemiballismus is characterised by irregular, coarse, violent, flinging movements of the limbs, primarily due to contraction of the proximal muscles, whereas chorea presents as continuous, random, jerking movements involving the distal and proximal muscles, or kicking, mainly in the proximal joints.(1) These involuntary movements have been described with lesions in the subthalamic nucleus, corpus striatum, cerebral cortex, thalamus and brainstem. Chorea and hemiballismus can result from a variety of conditions, including stroke, infection, drugs, metabolic abnormalities, tumours and hyperglycaemia in diabetic patients.(2)
The exact clinical pathophysiology of hyperglycaemia-induced chorea-hemiballismus is poorly understood. Postulated mechanisms include:(3) (a) hyperglycaemia and associated hyperviscosity, which can disrupt the blood-brain barrier, leading to intracellular acidosis and regional metabolic failure; (b) petechial haemorrhage or striatal infarction; (c) an increase in sensitivity of dopamine receptors during the postmenopausal period, possibly triggering hyperkinesis in an appropriate setting; and (d) decreased thalamic or striatum gamma-aminobutyric acid (GABA) due to lack of acetoacetate for GABA conversion in a nonketotic state. In our patient, MR imaging of the brain revealed only T1 hyperintense signal changes in the right putamen. There was no susceptibility in the gradient-echo images to suggest haemosiderin deposition from haemorrhage and no restricted diffusion in the diffusion-weighted images to suggest acute infarction. This is similar to the findings in another local study by Kandiah et al.(4) In their study, patients with hyperglycaemic choreoathetoid movements were further investigated on MR spectroscopy, which found reduced N-acetylaspartate and increased choline levels in five patients. In two patients, myo-inositol levels were also elevated. The findings from that study(4) supported hyperviscosity as the cause of T1 hyperintensity in the basal ganglia due to the following reasons: (a) all their patients had significantly elevated serum osmolarity at the time of choreoathetosis; (b) varying signal changes on T2-weighted images may be reflective of the difference in patterns and severity of hyperviscosity, which can result in reduced water diffusion and altered T2 relaxation time, as demonstrated in animal studies;(5) (c) elevated myo-inositol levels also support the hyperviscosity theory, as myo-inositol is an organic osmolyte that regulates astrocytic volume. Persistent hyperglycaemia may lead to excessive formation of glucose-6-phosphate, which is a precursor of inositol-1-phosphate and a substrate for myo-inositol biosynthesis;(6) and (d) elevated choline levels suggest ongoing cellular proliferation in the putamen.
In a study by Shan et al,(7) stereotactic biopsy performed on a patient under MR-guidance revealed a fragment of gliotic brain tissue with abundant gemistocytes. Gemistocytes are swollen reactive astrocytes that appear during acute injury and shortening of T1 relaxation time secondary to the protein hydration layer inside the gemistocytes’ oedematous cytoplasm. This may also explain the elevated choline levels reported in the study by Kandiah et al.(4) There was no evidence of demyelination, haemorrhage or infarction.(7)
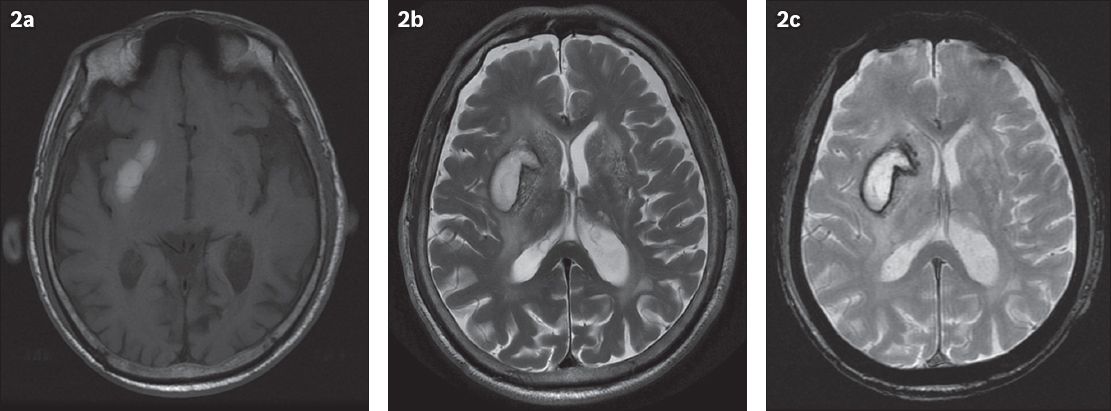
A differential diagnosis must be considered for T1 hyperintense changes in the putamen or basal ganglia. The causes of T1 hyperintense lesions can be classified into four categories: paramagnetic substances; calcification; hamartoma; or indeterminate.(8) Paramagnetic substances include methaemoglobin, seen in subacute intracranial haemorrhage. In the early stages (3–7 days) of subacute haemorrhage, methaemoglobin in intact red blood cells increases T2-proton relaxation enhancement, resulting in high signal intensity on T1-weighted images but low signal intensity on T2-weighted images. In the late subacute stage (1–2 weeks), haemolysis brings about the release of methaemoglobin to the haematoma (Figs.
Fig. 2
Right basal ganglia subacute intraparenchymal haematoma in a 90-year-old patient who suffered a haemorrhagic stroke. MR images show (a) axial T1 and (b) T2 hyperintensity and (c) haemosiderin deposition in the right basal ganglia on the gradient-echo image, resulting in susceptibilities.
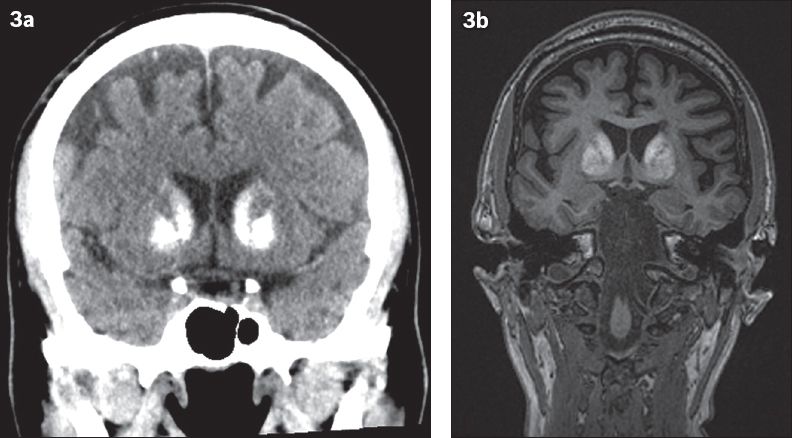
Basal ganglia calcification is more easily assessed on CT than MR imaging (
Fig. 3
A 52-year-old patient was investigated for early-onset dementia. (a) Coronal CT images show dense calcifications in the bilateral basal ganglia and (b) coronal MR images show corresponding T1 hyperintensity, suggestive of Fahr’s disease.
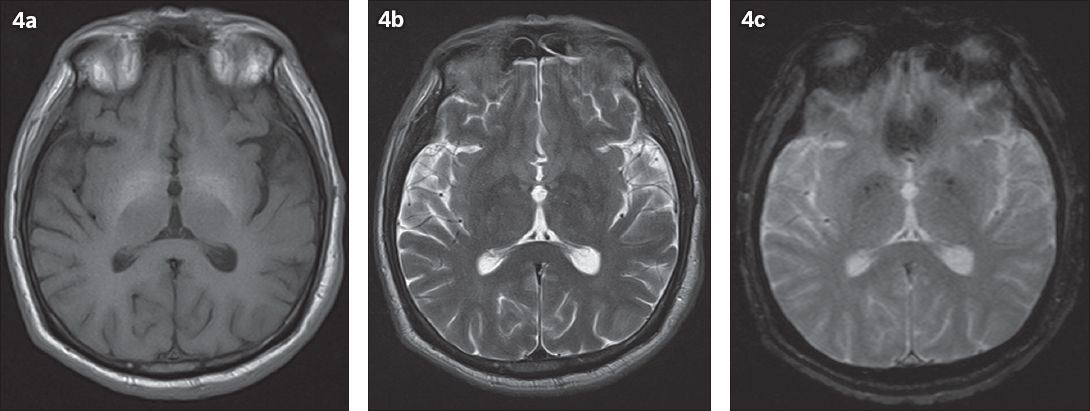
Symmetrical T1 hyperintensities in the bilateral globus pallidus (
Fig. 4
A 52-year-old patient with known chronic liver cirrhosis from hepatitis C and chronic alcohol consumption. Axial MR images show (a) T1 hyperintensity in the bilateral basal ganglia without corresponding (b) T2-weighted and (c) gradient-echo signal changes.
Acute chorea-hemiballismus caused by hyperglycaemia is a treatable disorder with good prognosis.(2) In a study by Lai et al,(2) hyperkinesis resolved dramatically in all patients except one, after control of hyperglycaemia; this was similar to our case. Their study also found that findings on sequential neuroimaging correlated well with the clinical course, although resolution of imaging findings lagged behind clinical recovery.(2) In summary, there are several causes of T1 hyperintense basal ganglia lesions. Hyperglycaemia should be considered in the appropriate clinical context and corrected early in the management of these patients.
SMJ-57-165.pdf