

Abstract
INTRODUCTION
We aimed to compare the early clinical manifestations, laboratory results and chest computed tomography (CT) images of COVID-19 patients with those of other community-acquired pneumonia (CAP) patients to differentiate CAP from COVID-19 before reverse transcription-polymerase chain reaction results are obtained.
METHODS
The clinical and laboratory data and chest CT images of 51 patients were assessed in a fever observation ward for evidence of COVID-19 between January and February 2020.
RESULTS
24 patients had laboratory-confirmed COVID-19, whereas 27 individuals had negative results. No statistical difference in clinical features was found between COVID-19 and CAP patients, except for diarrhoea. There was a significant difference in lymphocyte and eosinophil counts between COVID-19 and CAP patients. In total, 22 (91.67%) COVID-19 patients had bilateral involvement and multiple lesions according to their lung CT images; the left lower lobe (87.50%) and right lower lobe (95.83%) were affected most often, and all lesions were located in the peripheral zones of the lung. The most common CT feature of COVID-19 was ground-glass opacity, found in 95.83% of patients, compared to 66.67% of CAP patients.
CONCLUSION
Diarrhoea, lymphocyte counts, eosinophil counts and CT findings (e.g. ground-glass opacity) could help to distinguish COVID-19 from CAP at an early stage of infection, based on findings from our fever observation ward.
INTRODUCTION
As COVID-19 is highly transmittable, the ability to quickly distinguish infected patients from those who are not infected is of great importance. The gold standard of diagnosing COVID-19 is via the use of SARS-CoV-2 (severe acute respiratory syndrome coronavirus 2) nucleic acid test by reverse transcription-polymerase chain reaction (RT-PCR).(1) However, the test itself takes time, and facilities for processing tests may be geographically sparse, causing delays and anxiety to patients and medical personnel.
We herein compared two groups of patients who, between 20 January and 12 February 2020, attended a fever observation ward that had a mixture of COVID-19-infected patients and community-acquired pneumonia (CAP) patients. We examined the clinical features and computed tomography (CT) images of these two groups, to distinguish patients who were likely to have been infected by COVID-19 from those who had CAP. Such considerations, if taken, may improve the speed of diagnosis and prevent nosocomial infections when RT-PCR tests are difficult to access or slow to return results.(2) CT is considered to provide strong evidence for early diagnosis of COVID-19, as infections in the lungs can sometimes be spotted earlier than the other symptoms.(3)
In China, the spread of COVID-19 has been successfully suppressed. It is believed that fever clinics and fever observation wards have played a key role at the front line of the epidemic prevention system.(2,4) At our hospital, Ningbo First Hospital in Ningbo, Zhejiang province, China, a fever observation ward was set up to screen subjects arriving at the fever clinic. In the present study, we demonstrate how one may quickly establish whether a patient was likely to have been infected by COVID-19, so as to provide them with timely treatment and isolation, if required.
METHODS
We performed a retrospective study at a single tertiary centre, Ningbo City First Hospital, from 20 January to 12 February 2020. This study was carried out in accordance with the amended Declaration of Helsinki, and was evaluated and approved by the Medical Ethical Committees (2020-R052). Written informed consent was waived because no harm could potentially be caused to patients.
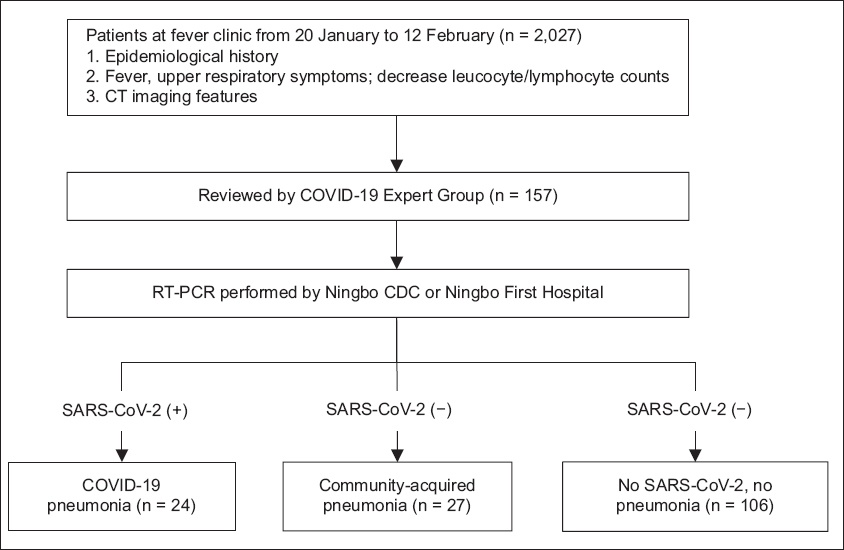
Inclusion criteria were: all patients with epidemiological history, fever and upper respiratory tract symptoms who visited the fever clinic and were screened with CT and throat swab. All COVID-19 cases were laboratory-confirmed using the criteria for SARS-CoV-2 infection from the National Health Commission of the People’s Republic of China.(5,6) Non-COVID-19 CAP cases were confirmed by clinical observation, and all tested negative for SARS-CoV-2 via throat swab specimens using RT-PCR performed either at Ningbo Centre for Disease Control and Prevention or Ningbo First Hospital. CAP is characterised by acute symptoms and signs of lower respiratory tract infection without other obvious causes, with new pulmonary infiltrate visualised on chest radiographs.(7) The RT-PCR kits were made by Shanghai Geneodex Biotechnology Limited and LifeRiver Biotech Corp, Shanghai (SKU Z-RR-0479-02-25) during 12–18 February and 19 February–8 March 2020, respectively. Clinical data including gender, age, epidemiological history, symptoms, signs, blood test results and CT findings was retrieved from the patients’ electronic medical records (
Fig. 1
Flowchart shows patient enrolment for the study. CAP: community-acquired pneumonia; CDC: Center for Disease Control and Prevention; RT-PCR: reverse transcription-polymerase chain reaction; SARS-CoV-2: severe acute respiratory syndrome coronavirus 2
Chest high-resolution CT (HRCT) imaging was conducted before admission or within 24 hours of admission in the fever observation ward. Patients were asked to breathe in and hold their breath while the imaging was in progress. The CT models were set to SOMATOM sensation 16 CT. The imaging parameters used were as follows: tube voltage 120 kV, tube current 230 mA, rotation time 0.5 seconds to 0.75 seconds, slice thickness 5 mm, and B70f very sharp algorithm with 10-mm thickness for reconstructions. All study participants underwent HRCT with the same machine.
Two senior radiologists or chest physicians with at least five years of experience reviewed all CT images. Image features included distribution of lesions in the lung, ground-glass opacity (GGO), mixed GGO, reticular pattern, consolidation, vascular enlargement, air bronchogram sign, tree-in-bud sign, bronchial dilatation, cystic change, airway thickening, pleural effusion, lymphadenopathy, interlobular septal thickening and subpleural linear opacity. The affected lung lobes and segments were also counted.
Continuous data was analysed using mean ± standard deviation and median (interquartile range). Data across groups was compared using unpaired t-test or Mann-Whitney U test. Categorical variables were expressed as counts and percentages in each category, and then tested for significance using chi-square test or Fisher’s exact test. All data was analysed using IBM SPSS Statistics version 26.0 (IBM Corp, Armonk, NY, USA).
RESULTS
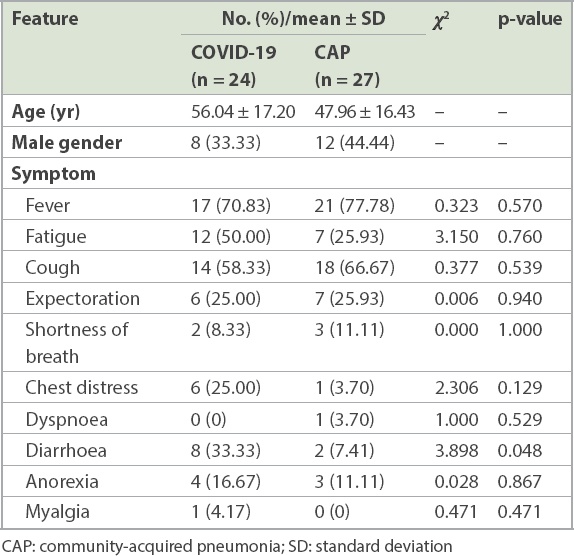
A total of 24 patients tested positive for SARS-CoV-2, 19 of whom had a history of exposure to COVID-19, while five had recently visited Wuhan or Hubei, China. 27 patients had testeda negative for SARS-CoV-2 and were treated as CAP patients during hospitalisation; of these patients, four had a history of exposure to COVID-19 and nine had a travel or residence history in an epidemic area. All patients had been discharged. Among the COVID-19 patients, the median time from exposure till onset of symptoms and admission to the fever observation ward (i.e. incubation days) was 9.71 ± 4.26 days. Correspondingly, the median time for symptom onset to admission to the fever observation ward of the non-COVID-19 CAP group was 8.93 ± 4.68 days. Fever (70.83%), fatigue (50.00%) and cough (58.33%) were the most common symptoms of the COVID-19 patients, while fever (77.78%), cough (66.67%), fatigue (25.93%) and expectoration (25.93%) were the most common symptoms among the non-COVID-19 CAP patients. No statistical difference in clinical features could be observed between COVID-19 and non-COVID-19 CAP patients except for diarrhoea, which was more prevalent among the COVID-19 patients (
Table I
Clinical manifestations of COVID-19 pneumonia and CAP.
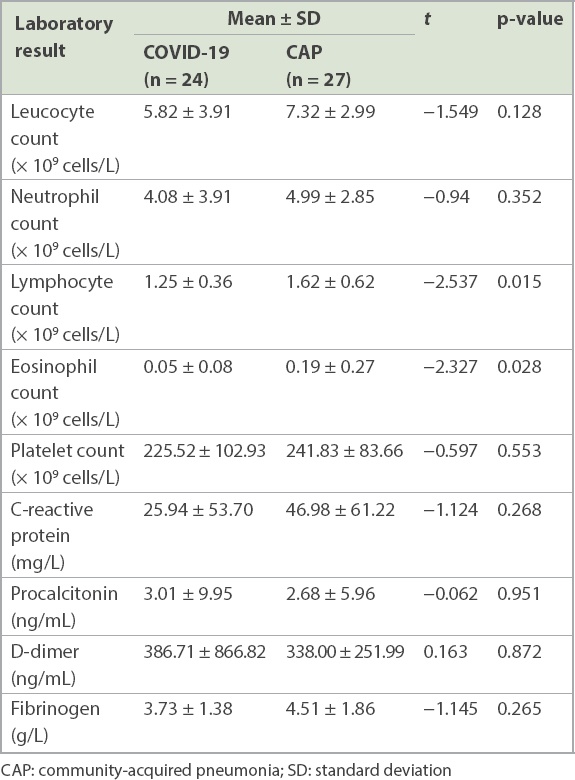
As shown in
Table II
Laboratory results of COVID-19 pneumonia and CAP.
The CT findings of the COVID-19 and non-COVID-19 CAP groups are shown in
Table III
Comparison of computed tomography findings of COVID-19 and CAP.
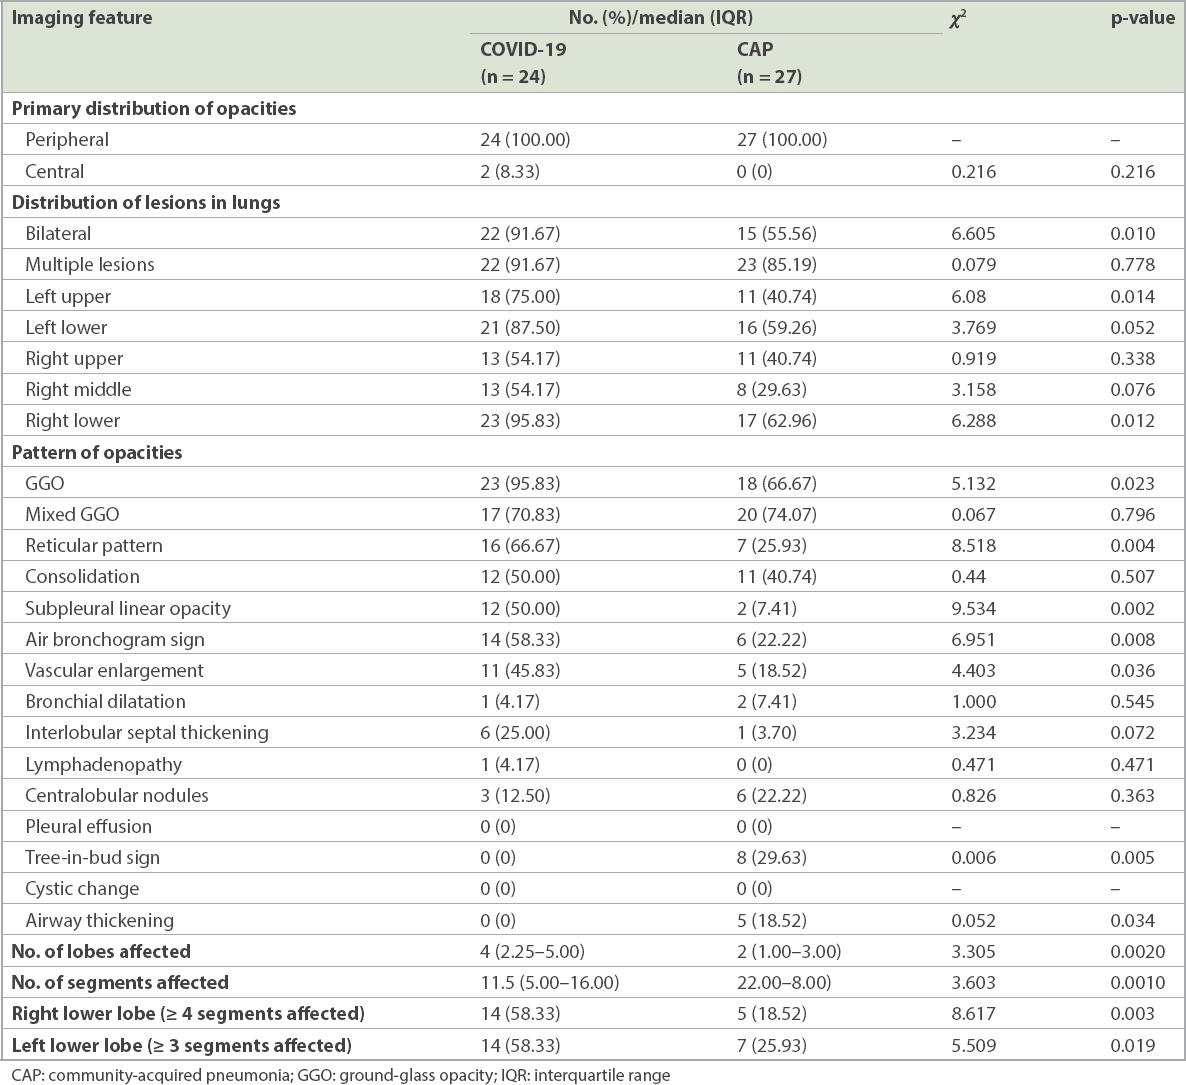
Fig. 2
Ground-glass opacity (GGO) was the most common feature of chest CT imaging in COVID-19 patients. (a) CT image shows GGO in the subpleural space of the right lower lung of a 47-year-old man. He presented with slight cough on Day 4 and fever on Day 10 after having dinner with confirmed cases, and was laboratory-diagnosed with COVID-19 at the first nucleic acid test. (b) CT image shows GGO in the peripheral zone of the left lower lung of a 56-year-old man. He presented with cough on Day 10 and fever on Day 13 after travelling to Wuhan, and was laboratory-diagnosed with COVID-19 by a positive nucleic acid test. (c) CT image shows multiple patchy GGO in the subpleural space of both sides of the lungs of a 57-year-old man. He began to present with fever two days before admission after living together with family members who had COVID-19, and was laboratory-diagnosed. (d) CT image shows multiple mixed GGO in both lungs of a 51-year-old woman. She presented with fever and chills seven days after returning from Wuhan, and was laboratory-diagnosed with COVID-19.
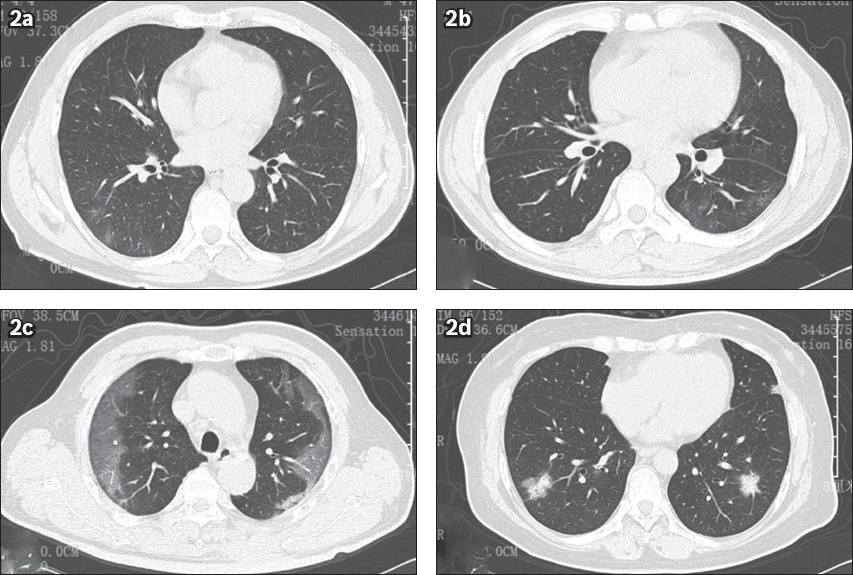
Fig. 3
Reticular pattern of COVID-19. (a) Chest CT image shows grid shadows in the right lower lung of a 96-year-old man, an asymptomatic infector who went to our hospital for a check-up because several of his family members were successively diagnosed with COVID-19 pneumonia after a temple activity. His first nucleic acid test was positive for SARS-CoV-2. (b) Chest CT image shows grid shadows in the subpleural space of lower lobes of both lungs of a 54-year-old man. He presented with fever and cough five days after attending meetings together with a case from Wuhan, and was laboratory-confirmed as having COVID-19. (c) Chest CT image shows typical grid shadows in the subpleural space of the left lower lung of a 64-year-old woman. She presented with fever seven days after attending a temple activity and tested positive for SARS-CoV-2. SARS-CoV-2: severe acute respiratory syndrome coronavirus 2
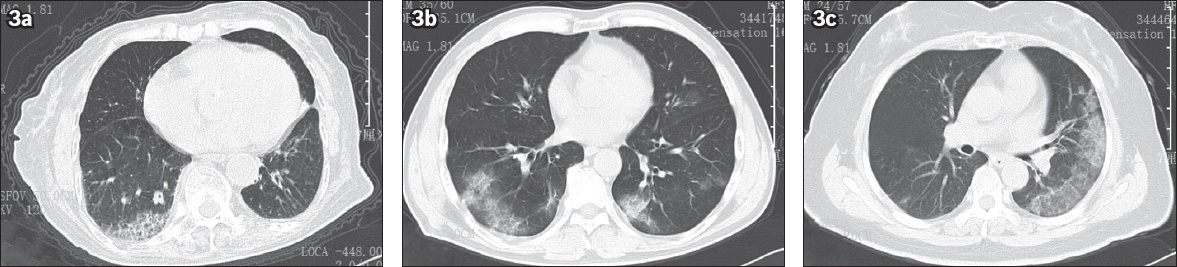
Fig. 4
The air bronchogram sign and vascular enlargement in COVID-19. (a) CT image shows ground-glass opacity (GGO) and the air bronchogram sign in the peripheral zone of the right lower lung of a 67-year-old man. He presented with fever on Day 11 after his wife attended a temple activity and attended our hospital on Day 14; his first nucleic acid test was positive for SARS-CoV-2. (b) CT image shows GGO and the air bronchogram sign in the right lower lung of a 59-year-old woman. She presented with fever on Day 3, diarrhoea on Day 7 and dry cough on Day 10 after attending a temple activity. Her first laboratory test for SARS-Cov-2 was negative on Day 9, but her second result was positive. (c) CT image shows GGO and the air bronchogram sign in the left lower lung of a 54-year-old man. He presented with fever and cough five days after attending meetings together with a case from Wuhan, and was laboratory-confirmed as having COVID-19. SARS-CoV-2: severe acute respiratory syndrome coronavirus 2
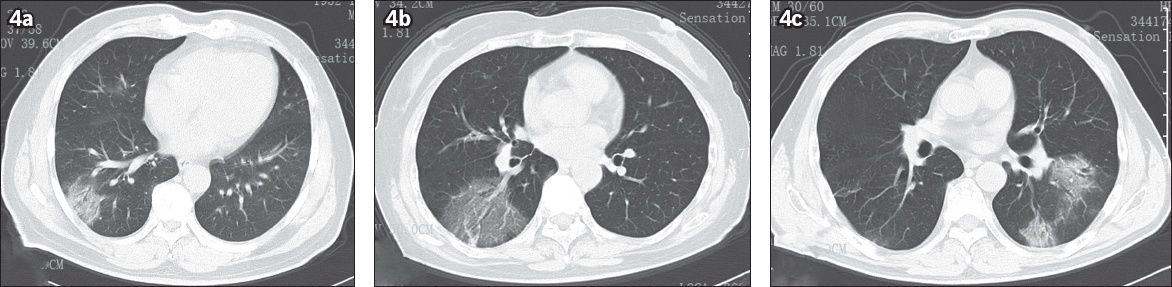
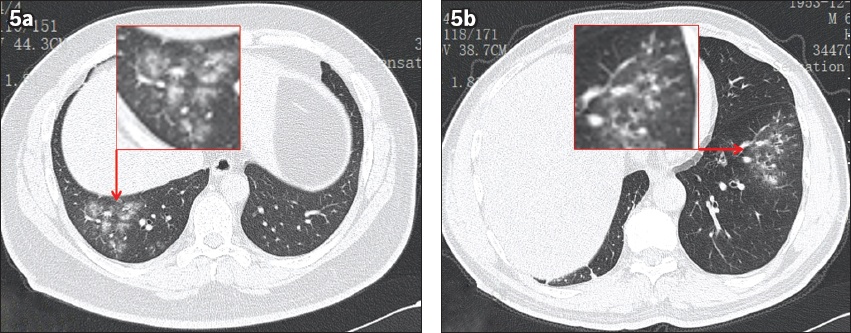
Fig. 5
The tree-in-bud sign and airway thickening in non-COVID-19 community-acquired pneumonia. (a) CT image shows pneumonia along the bronchi and the tree-in-bud sign in the left lower lung of a 66-year-old man. He presented with fever of two days’ duration and was admitted to our hospital without any contact history with COVID-19. (b) CT image shows flocculent pneumonia lesions distributed along the bronchus, with the tree-in-bud sign in the right lower lung of a 36-year-old man. He presented with diarrhoea for two days and fever for half a day, and was admitted to our hospital without any contact history with COVID-19.
DISCUSSION
In this retrospective study, we reported the clinical features of 51 patients at admission as well as their laboratory results and CT findings. These included 24 laboratory-confirmed COVID-19 cases and 27 non-COVID-19 CAP cases. All patients were admitted into the fever observation ward. We found that diarrhoea, lymphocyte and eosinophil counts, and CT manifestations could help to distinguish COVID-19 from CAP before the results of RT-PCR become available.
With the number of laboratory-confirmed COVID-19 cases rising to over two million worldwide at the time of writing, prevention and treatment of COVID-19 have reached a new stage.(8) As SARS-CoV-2 is a highly contagious disease, taking effective measures to limit its spread is of great importance. Fever observation wards were established all over China as frontline care to fight COVID-19.(2) These fever observation wards became the first port of call for suspected patients who suffered from fever and respiratory symptoms, or those who had been in contact with confirmed cases. They were medically observed until their infection status could be validated with an RT-PCR test. Epidemiological, clinical, laboratory and image findings believed to be associated with COVID-19 were all carefully investigated when patients were admitted into fever observation wards.
Our previous study reported that fever, fatigue and cough were the most common symptoms of COVID-19,(1) while fever, cough and expectoration were the most common symptoms of CAP patients.(9) In this study, there was no statistical difference in clinical features between COVID-19 and CAP, except for diarrhoea. 33.33% of COVID-19 patients were presented as suffering from diarrhoea at admission in this study and 23.8% patients in our previous study,(1) compared to 3% or 2% in other cohorts.(10,11) Similarly, the percentage of patients who suffered from diarrhoea among those who had been diagnosed with Middle East respiratory syndrome (MERS) and SARS ranged from 12.3% to 33.3%.(12-14) Therefore, medical personnel should be highly vigilant when encountering patients with fever accompanied by diarrhoea or those with viral pneumonia CT features and diarrhoea, and should segregate the patients according to their epidemiological history and apply RT-PCR tests.
Laboratory results showed that lymphocyte and eosinophil counts were significantly lower in SARS-CoV-2 infection than in other pathogenic pneumonia. As a recent study reported, lymphopenia was present in more than 40% of 500 COVID-19 patients,(15) compared to 28% of the 91 patients in our previous study.(1) T-cell counts are significantly reduced in COVID-19 patients, including CD4 and CD8 cells. It was reported that CD4 T lymphocyte counts could be associated with the severity of COVID-19.(16) Furthermore, in this study, 15 (64.50%) patients were suffering from eosinopenia, compared to 47 (51.65%) of 91 COVID-19 patients in our previous report.(1) Eosinopenia can be used as a biomarker for differentiating infectious diseases in the intensive care unit and the general internal medicine department.(17) Therefore, it may be used as a marker to differentiate SARS-CoV-2 infection from other infectious diseases;(18) however, whether it is linked to the severity of COVID-19 still requires further investigation.
In the early CT images, COVID-19 patients were usually found to have two or more lobes infected, usually the right lower and left lower lobes. In the present study, 87.50% of left lower lobes and 95.83% of right lower lobes were affected, and all lesions were located in the peripheral zones of the lung in COVID-19 patients. Similarly, Han et al reported that only 35% of participants had a single lobe affected, usually the right lower lobe.(19) This result might be related to the anatomy of the lung bronchus distribution.(19)
GGO or mixed GGO is the most common early CT manifestation of COVID-19. Song et al reported that pure GGOs were bilateral and found in 77% of COVID-19 patients,(20) while this proportion was 100% in a study by Caruso et al in Rome, Italy.(21) Furthermore, Cheng et al compared COVID-19 and non-COVID-19 pneumonia patients at fever observation departments, and showed that GGO and mixed GGO were observed in all COVID-19 patients, located predominantly in the peripheral zones of the lungs.(2) Moreover, GGO was also a predominant feature of imaging manifestations of SARS and MERS, which indicated diffused alveolar damage.(2) At the same time, it is worth emphasising that a reticular pattern and the air bronchogram sign were also detected as an early CT feature of COVID-19. On the other hand, the tree-in-bud sign and airway thickening were more common in non-COVID-19 pneumonia.
This study has some limitations. First, the number of cases was small and taken from a single centre in Ningbo, Zhejiang, China. It would be helpful to investigate the clinical features, laboratory results and CT findings from a large cohort. Second, this was a retrospective study using early CT images obtained from COVID-19 and CAP patients in a fever observation ward. There was no follow-up CT to observe whether there were any changes in the lung lesions of all patients. Third, we did not identify the type of pathogens that caused CAP in patients with CAP and only confirmed that it was not SARS-CoV-2 infection.
In conclusion, epidemiological history, clinical features, blood tests and CT features could help to distinguish COVID-19 from non-COVID-19 CAP in early stages based on the experience of our fever observation ward. Applied with care, this information could help to stop nosocomial infections and allow patients to receive disease-appropriate treatments more quickly.
ACKNOWLEDGEMENTS
This work was partially supported by the Natural Science Foundation of Zhejiang Province (Q17H010001, LY19H010001), Natural Science Foundation of Ningbo City (202003N4019), and the Medical and Health Technology Development Program in Zhejiang Province (2017KY573), China.