

Abstract
Pericarditis and myocarditis are characterised by electrocardiographic changes and elevated cardiac enzymes, respectively, and patients with perimyocarditis often complain of chest discomfort. These findings are nonspecific and often lead to diagnostic difficulties, as ST-elevation myocardial infarction commonly presents in a similar fashion. Clinical differentiation between perimyocarditis and myocardial infarction are especially important because adverse side effects can occur if reperfusion therapy is administered for a patient with acute pericarditis or if a diagnosis of acute myocardial infarction is missed. We herein describe a case of perimyocarditis with ST elevation and raised cardiac markers, which led to two emergency coronary angiographies that were subsequently found to be normal. We include the three serial electrocardiographies (ECGs) performed to show the characteristic features of perimyocarditis and further discuss the importance of identifying typical and atypical ECG features of pericarditis.
INTRODUCTION
Acute pericarditis and myocarditis share similar aetiologic agents. Therefore, it is not uncommon for both pathologies to coexist. The clinical presentation of perimyocarditis varies widely, depending on the extent of perimyocardial involvement, which may be focal or diffuse, and patients’ symptoms may range from being completely asymptomatic to severely unwell with heart failure. Patients with perimyocarditis may present with chest pain, elevated cardiac enzymes and ST elevation mimicking acute transmural myocardial infarction. We herein report a 77-year-old woman in whom symptoms of chest discomfort, electrocardiographic changes and elevated cardiac enzymes simulated acute myocardial infarction.
CASE REPORT
Following a one-day prodrome of fever and chills, a 77-year-old Chinese woman presented to the emergency department at Singapore General Hospital, Singapore, with chest discomfort. Her symptoms were associated with mild breathlessness especially on exertion. She did not have any associated symptoms such as sweating or nausea and vomiting. Her past medical history included angina secondary to mild-to-moderate coronary artery disease diagnosed on coronary angiography seven years ago. Other past medical histories included type 2 diabetes mellitus, hypertension, hyperlipidaemia, peripheral vascular disease and previous upper gastrointestinal tract bleeding.
On examination, her blood pressure was 110/70 mmHg, heart rate was 100 beats per minute, respiratory rate was 20 breaths per minute, and oxygen saturation at 95% on room air. Her temperature measured 37.5°C. Heart sounds were normal with no evidence of pericardial friction rub. Jugular venous pressure was not elevated, her lungs were clear on auscultation, and there was no evidence of peripheral oedema.
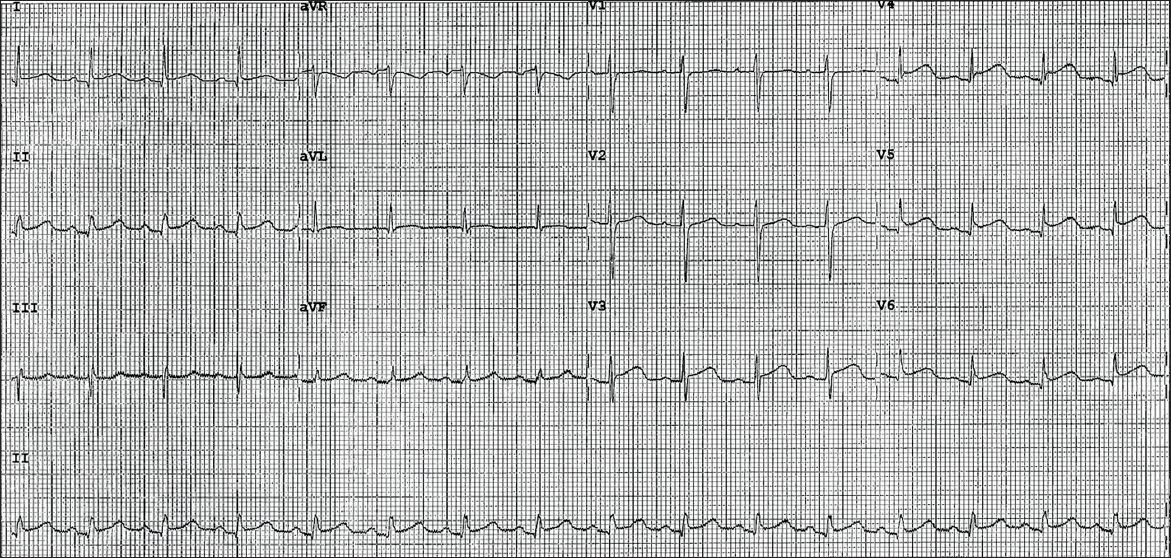
12-lead electrocardiography (ECG) performed on arrival at the emergency department showed 1 mm concave ST elevation in leads V3–6, I, II and aVF (
Fig. 1
Initial ECG shows widespread 1 mm concave ST elevations in leads V3–6, II and aVF.
In view of the patient’s past medical history, electrocardiographic changes, and ongoing chest pain refractory to intravenous glyceryl trinitrate infusion, she was loaded with dual antiplatelet therapy and underwent urgent coronary angiography. Presumptive diagnosis at this point was an acute coronary syndrome.
Coronary angiography showed a single-vessel disease with 70% stenosis of the left anterior descending (LAD) artery. There were no perfusion defects (TIMI grade 3 flow) in her coronary arteries. She was subsequently transferred to the coronary care unit for observation. Blood tests showed that the levels of her cardiac enzymes, taken at the emergency department, were elevated: troponin T, 0.71 (normal range [NR] < 0.03) µg/L; creatine kinase, 296 (NR 38–164) µg/L; and creatine kinase-MB, 10.1 (NR 0.5–5) µg/L. Her inflammatory markers were also elevated, with procalcitonin at 22 (NR < 0.5) µg/L and C-reactive protein at 55 (NR < 8.8) µg/L.
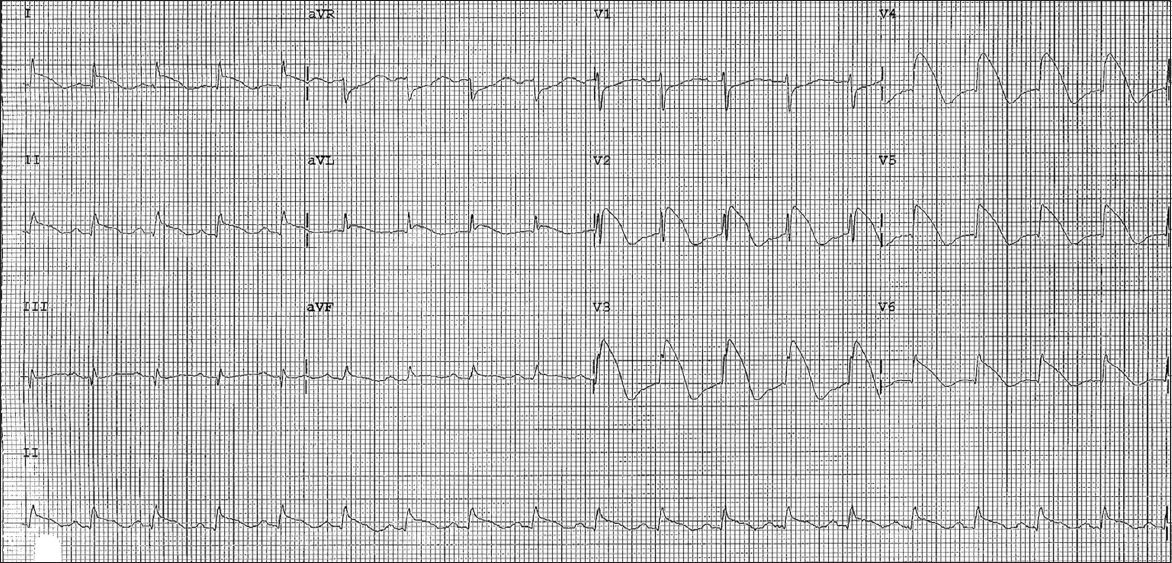
Serial ECG performed 12 hours later showed major ST elevation of up to 9 mm in leads V2–6, minor ST elevation of up to 2 mm in leads I, II, aVL and aVF, and reciprocal ST depression in leads aVR and V1 (
Fig. 2
Second ECG shows widespread convex ST elevations of up to 9 mm, and T-wave inversions in leads V2–6, I, II, aVL and aVF, as well as reciprocal ST depressions in leads aVR and V1.
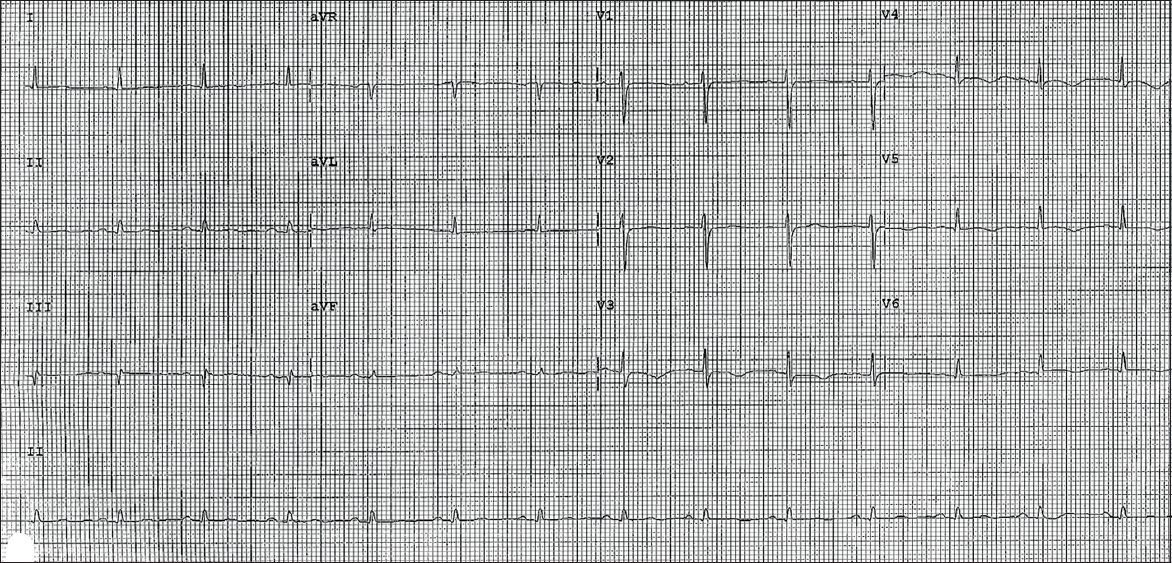
Virology screening was unremarkable. Two-dimensional transthoracic echocardiography showed normal left ventricular size, mildly impaired systolic function (ejection fraction 43%), and hypokinetic segments of the mid-inferoseptal and apical walls. There was also evidence of minimal pericardial effusion. Her cardiac enzymes remained elevated for more than a week but she remained asymptomatic with simple analgesia. Subsequent ECG showed evolutionary changes of pericarditis with normalisation of ST elevation and diffuse T-wave inversion (
Fig. 3
Subsequent ECG shows normalisation of ST segments and widespread T-wave inversions in leads V3–6.
DISCUSSION
A previous study showed that typical electrocardiographic evolution may be present in up to 60% of cases of pericarditis;(1) changes include diffuse ST elevation and PR depression, followed by normalisation of ST and PR segments, and then diffuse T-wave inversions.
ST elevation and PR depression may be found throughout most of the limb leads (I, II, aVL and aVF) and precordial leads V2–6. Reciprocal ST depressions in leads aVR and V1 are also suggestive of pericarditis (
In our patient, her presenting ECG (
ST elevations in STEMI characteristically conform to anatomical groupings of ECG leads that correspond to a localised coronary artery territory. In pericarditis, the pattern of ST elevation is widespread and most evident in precordial leads V5–6 and limb leads I and II.(2) In our patient, ST elevation in lead II, and its absence in lead III, is also suggestive of pericarditis.(2) Acute STEMI is often associated with reciprocal ST depression, which is not present in pericarditis except in leads aVR and V1. Pathological Q waves, which may occur with extensive injury in STEMI, are generally not seen in pericarditis. The development of diffuse T-wave inversions after the normalisation of ST segments is also characteristic of the later stages of pericarditis, and this feature is clearly demonstrated in our patient’s follow-up ECG (
Two-dimensional transthoracic echocardiography may also aid in the diagnosis of pericarditis. In our patient, the presence of pericardial effusion and regional wall motion abnormalities, which did not conform to any coronary artery territories expected from the electrocardiographic changes, further suggest the diagnosis of pericarditis.
Our patient most likely presented with acute pericarditis and subsequently developed acute myocarditis, causing a change in electrocardiographic morphology and a rise in cardiac enzymes. This case highlights that perimyocarditis may present with electrocardiographic changes and elevated cardiac enzymes that mimic myocardial infarction; coronary angiographies may be necessary to exclude an acute STEMI. While endo- or epimyocardial biopsy remains the gold standard for the diagnosis of perimyocarditis, we have demonstrated the role of coronary angiography and echocardiography in its diagnosis, and the importance of identifying typical and atypical ECG features of pericarditis.