

INTRODUCTION
Non-contrast computed tomography (NCCT) of the brain is the most widely used first-line imaging tool for assessing patients with acute stroke because of its widespread availability, fast scanning time and relatively low cost. It is used to exclude intracerebral haemorrhage and other lesions, such as tumours, that cause acute neurologic deficits. NCCT is also helpful in detecting early signs of ischaemic stroke, including loss of grey-white differentiation, sulcal effacement and hyperattenuation of major intracranial arteries.(1)
Hyperattenuation of an intracranial artery on NCCT is an indicator of an occluding clot in acute ischaemic stroke. It was first described in the middle cerebral artery (MCA) by Gács et al in 1983(2) and is known as the hyperdense MCA sign. This well-recognised early sign can similarly be observed in the other intracranial arteries of patients with acute ischaemic stroke, but these locations are less well-recognised compared to the hyperdense MCA sign.
In this article, we discuss and illustrate the hyperdense vessel sign at various intracranial artery locations in patients with acute ischaemic stroke, including a discussion of the hyperdense vessel sign involving the cerebral venous sinuses in cases of cerebral venous thrombosis (CVT). We also address potential pitfalls in diagnosis of the hyperdense vessel sign.
WHAT IS THE HYPERDENSE VESSEL SIGN?
The hyperdense vessel sign refers to focal increased attenuation of a vessel (either artery or vein) seen on NCCT. It indicates a fresh clot caused by vessel occlusion, mainly by a thrombus or embolus. The computed tomography (CT) attenuation value of non-occluded blood ranges from 40 to 43 (mean 41.3) Hounsfield units (HU).(3) Large intracranial arteries and the dural venous sinuses therefore normally appear isodense or minimally hyperdense, as normal adult grey matter measures approximately 39 HU.(4) High attenuation of a thrombus is due to extrusion of plasma in the thrombus with a subsequent increase in the local haematocrit level. The attenuation of an occlusive thrombus is in the range of 47‒61 (mean 54.0) HU.(3)
Hyperdense vessel sign in intracranial arteries
The hyperdense vessel sign is most widely reported in the MCA. The hyperdense MCA sign is seen as focal hyperattenuation of the M1 segment of the MCA on NCCT of the brain (
Fig. 1
(a) Non-contrast CT image of the brain shows a linear hyperdensity in the M1 segment of the left middle cerebral artery (MCA; arrow), typical of the hyperdense MCA sign in a patient with left hemispheric stroke. (b) CT angiogram of the same patient shows absence of contrast enhancement in the M1 segment of the left MCA, corresponding to the location of the hyperdense MCA.
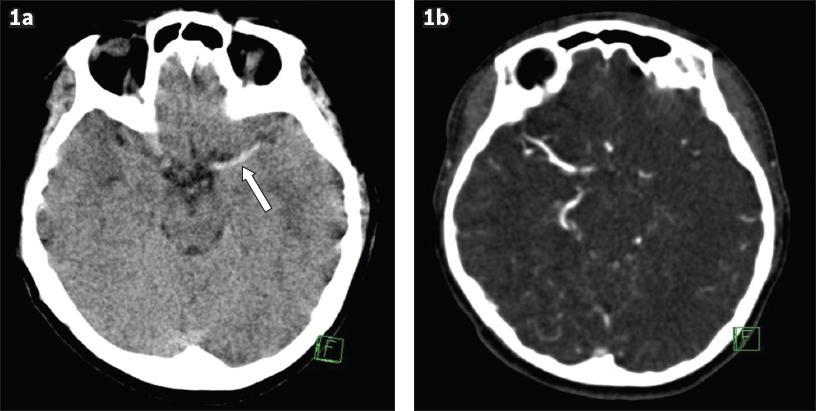
The hyperdense MCA sign is usually subjectively identified on NCCT of the brain when the MCA appears denser than its contralateral counterpart or surrounding brain density. More recently, objective measurements of the ratio of attenuation value of the affected MCA to the attenuation value of the contralateral vessel have been suggested.(7) The threshold ≥ 1.16 provided 100% sensitivity and 97% specificity, whereas ≥ 1.22 provided 94% sensitivity and 100% specificity.(7)
Similar to the hyperdense MCA sign, the hyperdense vessel sign can also be seen in the other intracranial arteries in the setting of acute ischaemic stroke. The MCA ‘dot’ sign describes hyperdensity of the MCA branches (either M2 or M3) beyond the MCA bifurcation seen in the Sylvian fissure(8) (
Fig. 2
(a) Non-contrast CT image of the brain shows a middle cerebral artery (MCA) ‘dot’ sign in the right Sylvian fissure (arrow) of a patient with right hemispheric stroke. This corresponds to a thrombus in the M2 segment of the right MCA. (b) Three-dimensional CT angiogram shows occlusion at the inferior division of the M2 segment of the right MCA (arrow).
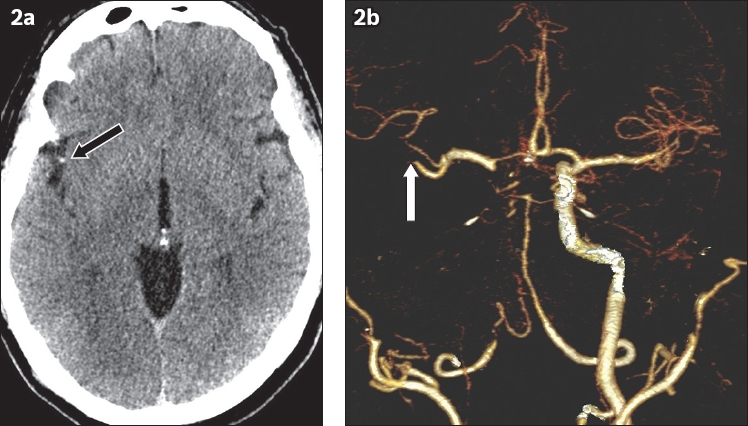
Fig. 3
(a) Non-contrast CT image of the brain shows the hyperdense vessel sign in the carotid segment of the right internal carotid artery (arrow) of a patient who presented with right hemispheric stroke. (b) MR angiogram shows complete loss of flow signal in the right internal carotid artery. (c) Diffusion-weighted MR image of the brain shows restricted diffusion in a linear distribution in the right centrum semiovale, corresponding to deep watershed cerebral infarct.
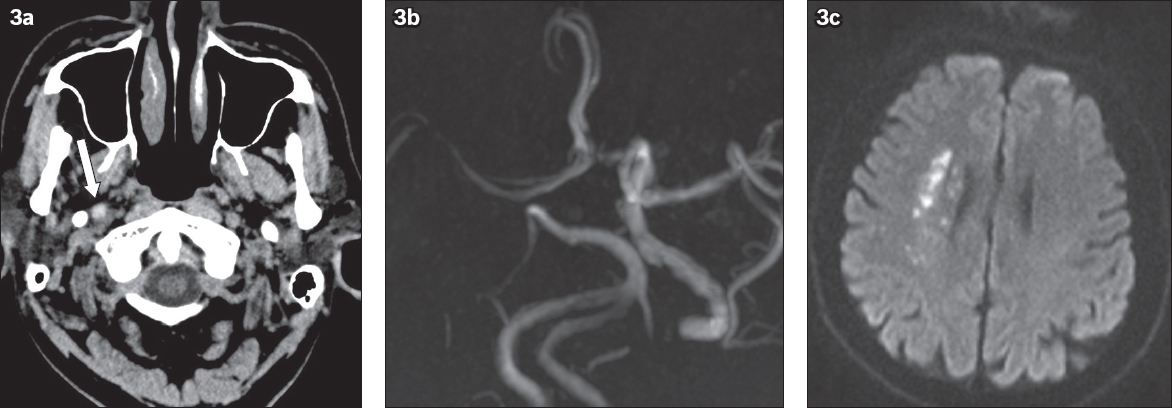
Fig. 4
(a) Initial non-contrast CT image of the brain shows a hyperdense A2 segment of the left anterior cerebral artery (ACA; arrow) of a patient who presented with ischaemic stroke. (b) MR angiogram shows absence of flow signal in the A2 segment of the left ACA (arrow). (c) Diffusion-weighted MR image of the brain shows restricted diffusion in the left frontal lobe, corresponding to left ACA territorial infarct.
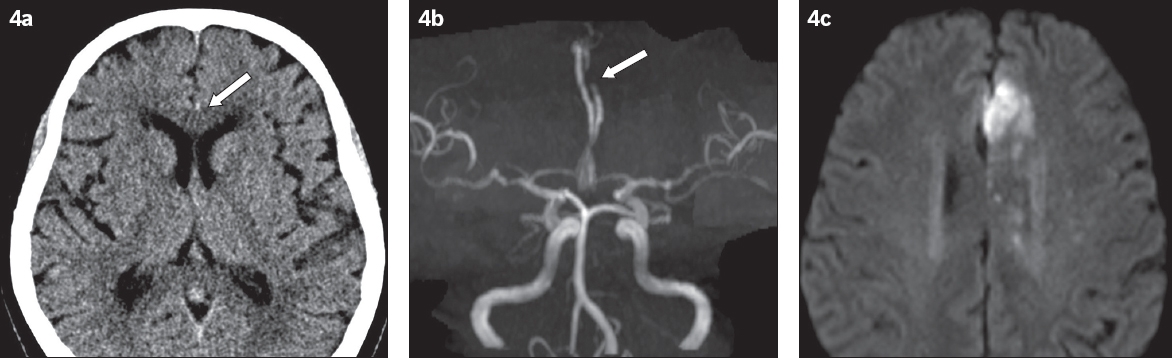
Fig. 5
Non-contrast CT image of the brain shows a hyperdense P2 segment of the right posterior cerebral artery (PCA; arrow), compared to the normal contralateral PCA (arrowhead), of a patient with ischaemic stroke. There is also loss of grey-white differentiation in the occipital and right posterior temporal lobes, corresponding to the right PCA territorial infarct.
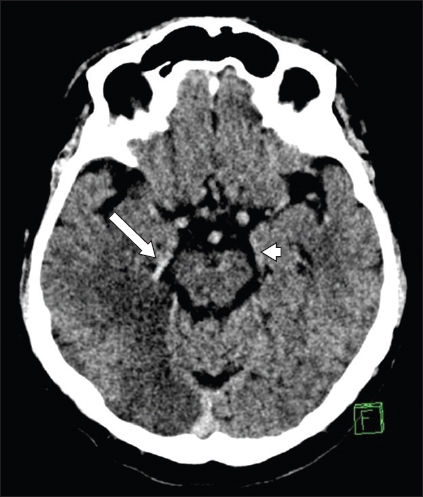
Fig. 6
Non-contrast CT image of the brain shows (a) a hyperdense basilar artery (arrow) and (b) hyperdense left vertebral artery (arrow) of a patient who presented with cerebellar stroke. (c) Time-of-flight MR angiogram shows absence of flow signal in the left vertebral artery and basilar artery. The right vertebral artery terminates as the posterior inferior cerebellar artery, which is a normal variant.
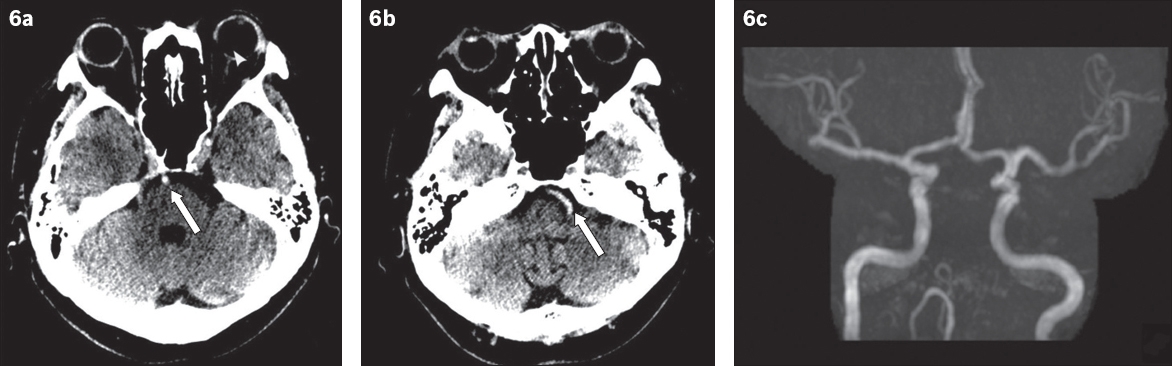
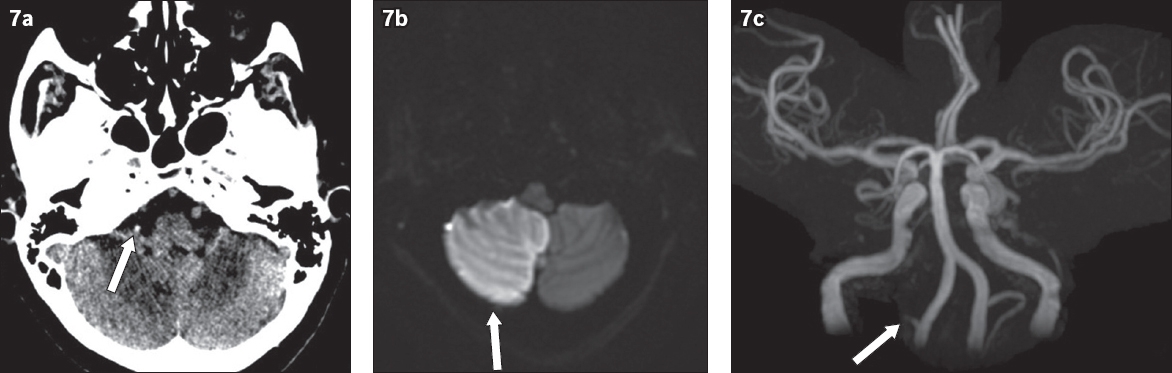
Fig. 7
(a) Non-contrast CT image of the brain shows a right hyperdense posterior inferior cerebral artery (PICA; arrow) in a patient who presented with cerebellar stroke. (b) Diffusion-weighted MR image of the brain shows restricted diffusion in the right PICA territory of the cerebellum (arrow). (c) Time-of-flight MR angiogram shows no flow signal in the right PICA (arrow). Good flow signal is observed in the normal contralateral left PICA.
Hyperdense vessel sign in cerebral venous sinuses
CVT is a relatively uncommon but serious neurologic disorder. The patient may present with generalised neurologic symptoms (headache is the most common symptom) and/or focal neurologic deficits, including seizure. Diagnosis of CVT is often missed or delayed due to its non-specific clinical presentation. A hyperdense thrombus in the occluded sinus is a classic finding of sinus thrombosis on NCCT. Unfortunately, it is only seen in about 20%‒25% of patients with CVT.(9,10) NCCT of the brain may only show subtle findings or appear normal in patients with CVT.
The superior sagittal sinus is the most commonly affected sinus (
Fig. 8
(a) Axial non-contrast CT image of the brain shows hyperdensity of the superior sagittal sinus (arrow) and cortical veins (arrowheads) in a patient who presented with severe headache. (b) Sagittal non-contrast CT image shows that the superior sagittal sinus (arrowheads) has higher attenuation compared to the vein of Galen (arrow). (c) Sagittal contrast-enhanced MR venogram of the same patient shows a linear filling defect within the superior sagittal sinus (arrowheads), confirming the diagnosis of superior sagittal sinus thrombosis.
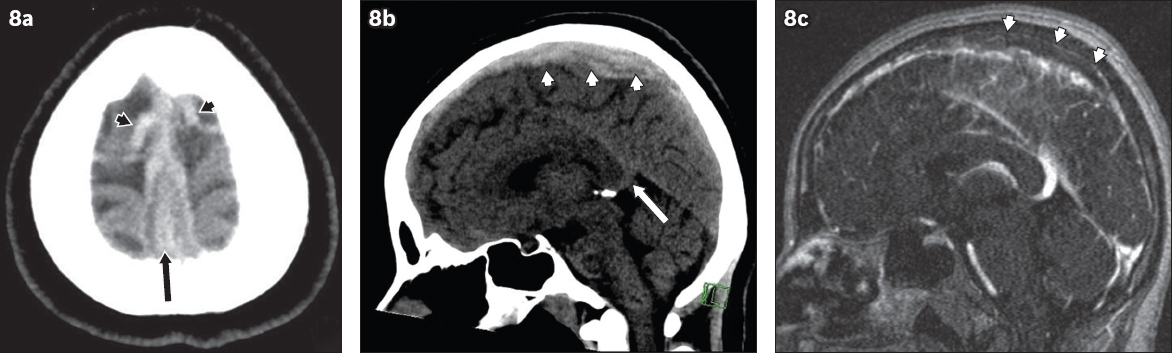
Fig. 9
Non-contrast CT images of the brain taken in the (a) axial and (b) coronal planes show the hyperdense vessel sign in the right transverse sinus (arrow in a & b) of a patient who presented with severe headache. (c) Phase contrast MR venography maximum intensity projection image confirms the finding of transverse sinus thrombosis by demonstrating an absence of flow signal in the expected region of the right transverse sinus (arrows).
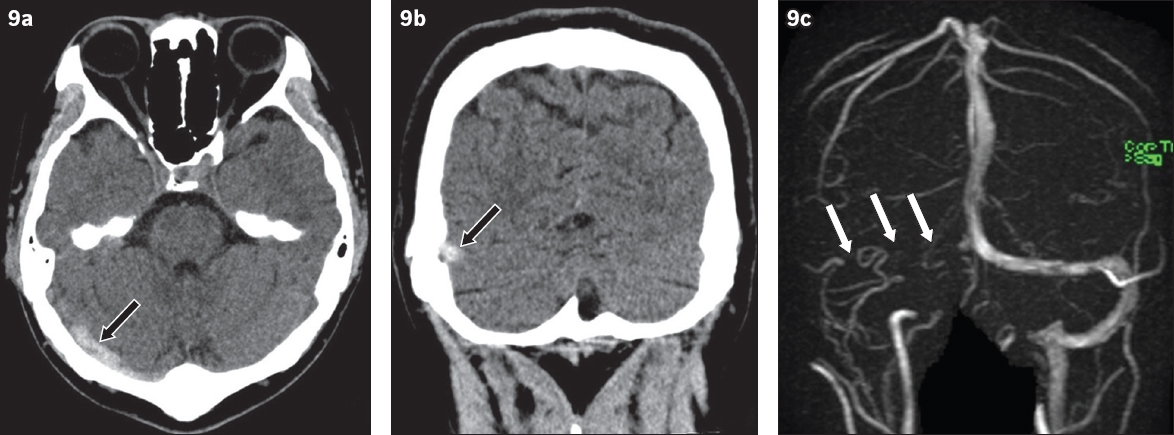
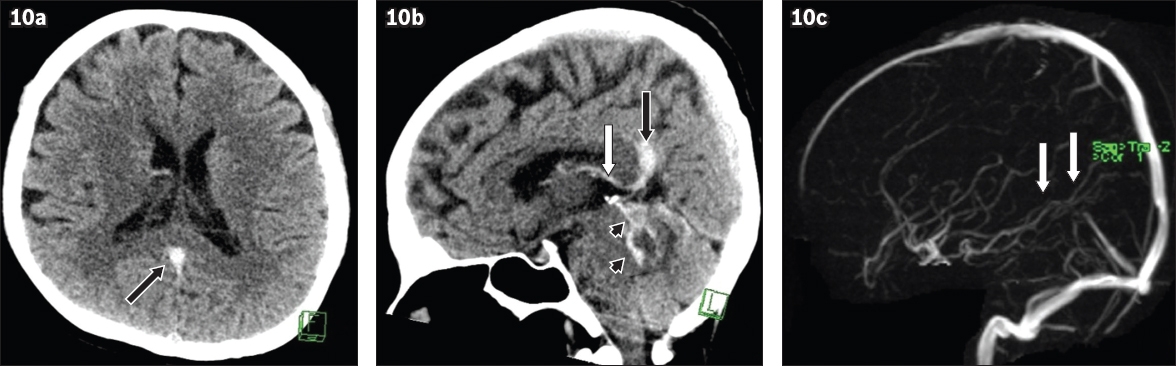
Fig. 10
(a) Axial non-contrast CT image of the brain shows the hyperdense vessel sign in the vein of Galen (arrow) of a patient who presented with severe headache and vomiting. (b) Sagittal non-contrast CT image shows that both the vein of Galen (black arrow) and internal cerebral vein (white arrow) appear hyperdense. Acute subarachnoid haemorrhage is also noted in the cerebellum (arrowheads). (c) Phase-contrast MR venography maximum intensity projection image shows no flow signal in the expected region of the vein of Galen and internal cerebral vein (arrows), confirming the diagnosis of thrombosis in the deep venous sinuses.
DIAGNOSTIC PITFALLS
Suboptimal window setting
NCCT of the brain is viewed at standard window settings of 35 HU (centre) and 100 HU (width).(12) Early ischaemic changes in the brain can potentially be missed if the images are viewed with only standard settings. Detection of early ischaemic changes, including the hyperdense vessel sign, on NCCT is significantly improved by utilisation of the stroke window settings (centre level of 35 HU and width of 30 HU)(12) (
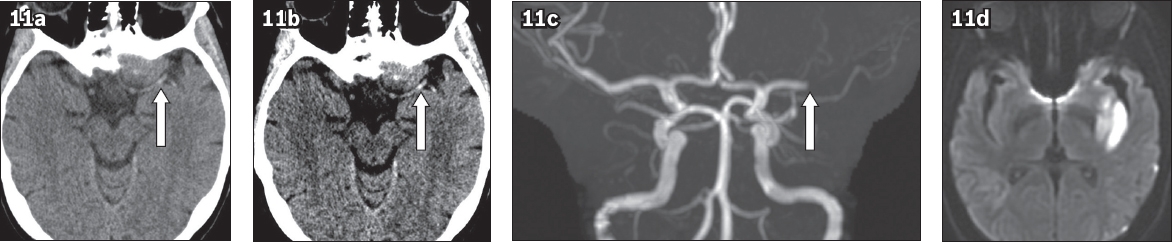
Fig. 11
(a) Non-contrast CT image of the brain obtained in standard window setting shows a probable focal hyperdensity in the M1 segment of the left middle cerebral artery (MCA; arrow) in a patient who presented with acute left hemispheric stroke. (b) Non-contrast CT image adjusted to stroke window settings shows a more conspicuous left hyperdense MCA sign (arrow). This emphasises the importance of interpreting non-contrast CT of the brain using two different window settings. (c) Time-of-flight MR angiogram shows complete occlusion at the M1 segment of the left MCA (arrow). (d) Diffusion-weighted MR image of the brain shows restricted diffusion in the left MCA territory, confirming the diagnosis of acute infarct.
Intracranial vascular calcification
Vascular calcification may mimic the hyperdense vessel sign. However, it is easy to confirm calcification of the intracranial arteries in most cases because of its high CT attenuation, which is close to that of bone (
Fig. 12
(a) Non-contrast CT image of the brain obtained in stroke window setting shows a hyperdense right middle cerebral artery (MCA; arrow). Its attenuation is close to that of a bone. In (b) standard and (c) bone window settings, the area of hyperdensity (arrow) can be seen located at the periphery of the MCA and appears curvilinear in shape. The overall imaging features are consistent with vascular calcification.
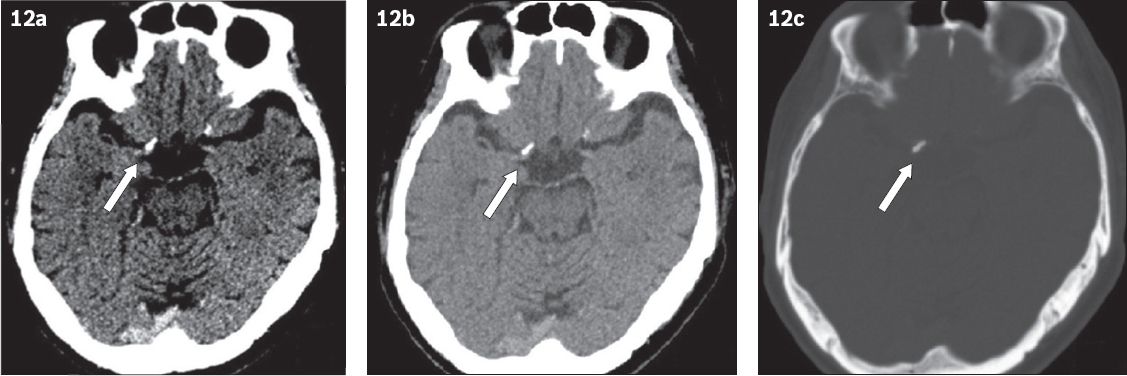
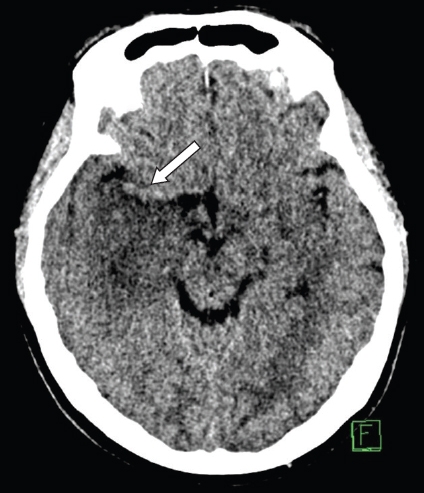
Fig. 13
Non-contrast CT image of the brain of an elderly patient shows a false-positive left hyperdense middle cerebral artery (MCA) sign (arrow). Subsequent MR imaging of the brain demonstrated no stroke in this patient (not shown). The patient has generalised increased density of the intracranial arteries, but as the bilateral MCAs are not imaged in the same plane, this gives a false impression of hyperdense appearance of left MCA as a result of partial volume averaging artefact.
Hypoattenuation of surrounding brain parenchyma
Intracranial arteries adjacent to a focal area of hypoattenuating brain parenchyma from certain aetiologies, such as encephalitis, could wrongly be interpreted as a positive hyperdense sign (
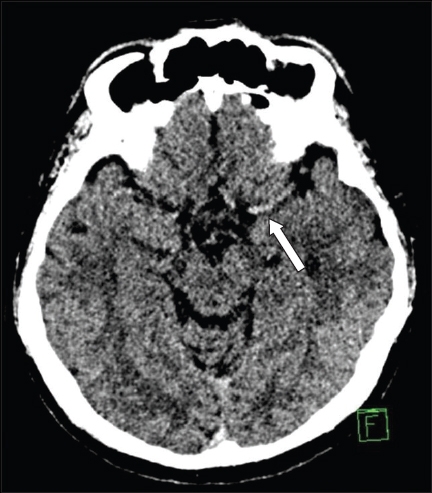
Fig. 14
Non-contrast CT image of the brain shows a focal area of hypodensity at the amygdala and hippocampus of the right temporal lobe, which is due to limbic encephalitis. The right middle cerebral artery gives a false impression of hyperdensity relative to the adjacent hypodense right temporal lobe (arrow).
Beam-hardening artefacts
Beam-hardening artefacts from bones, particularly those at the skull base, may increase the attenuation of the surrounding tissues. This may cause the adjacent vessels, particularly vertebrobasilar arteries and cerebral venous sinuses, to appear hyperdense on NCCT (
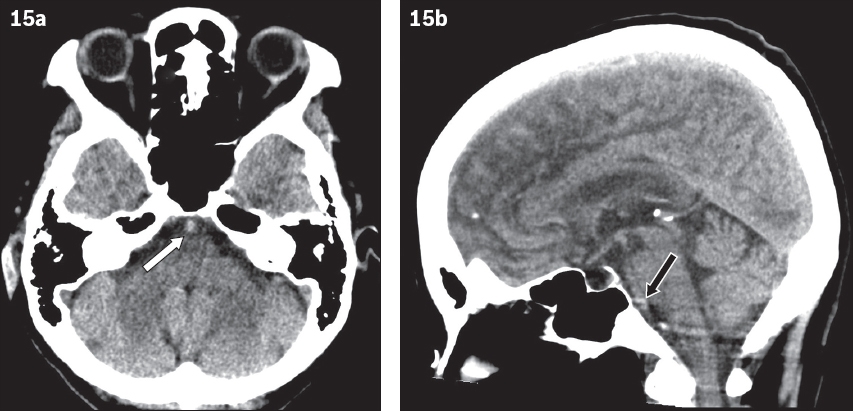
Fig. 15
(a) Non-contrast CT image of the brain in axial plane shows a possible hyperdense basilar artery (arrow). (b) Sagittal non-contrast CT image shows that the attenuation of the basilar artery is increased by beam-hardening artefacts from the adjacent thick bones of the skull base (arrow).
High haematocrit
High haematocrit levels, such as in polycythaemia, may be mistaken for the hyperdense vessel. Polycythaemia is a myeloproliferative neoplasm that is characterised by an overproduction of red blood cells leading to an elevation of haemoglobin concentration and haematocrit level. A linear relationship between CT attenuation values and the haematocrit values of whole blood preparations has been described by New and Aronow.(15) Therefore, NCCT of the brain of patients with polycythaemia could demonstrate hyperdense sulci and/or basal cisterns due to generalised increased density of the cerebral vessels, giving a pseudosubarachnoid haemorrhage appearance (
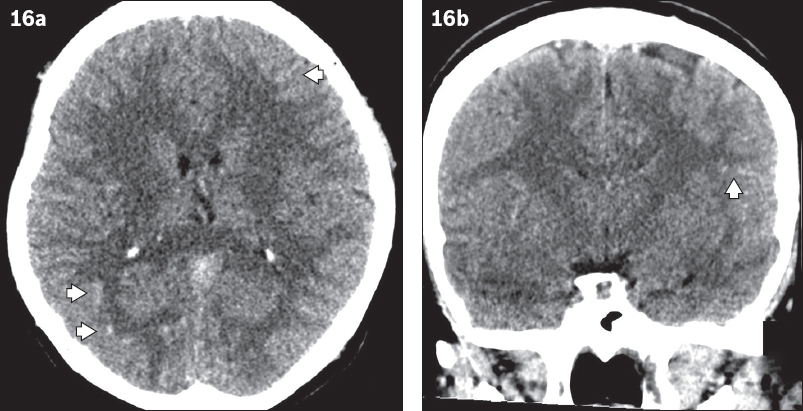
Fig. 16
Non-contrast CT images of the brain in (a) axial and (b) coronal views show diffuse sulcal hyperdensity in bilateral cerebral hemispheres (more prominent findings are marked by arrowheads) of a patient who presented with headache. This was initially reported as acute subarachnoid haemorrhage. The patient was subsequently diagnosed with polycythaemia vera. This appearance is due to generalised increased density of the cerebral vessels due to high haematocrit level, and is referred to as pseudosubarachnoid haemorrhage.
Venous thrombosis is a known complication of polycythaemia. This may lead to confusion in the diagnosis of CVT in patients with polycythaemia. Hyperdense blood may be difficult to differentiate from true dural venous thrombosis, but symmetry of involvement, homogeneity of the hyperdensity, and involvement of virtually all visualised dural venous sinuses and major venous structures should suggest the presence of polycythaemia rather than venous thrombosis.(16) In doubtful cases, magnetic resonance imaging, CT venography or catheter venography may be required to exclude CVT in patients with polycythaemia who have hyperdense venous sinuses.
CONCLUSION
The hyperdense vessel sign seen in NCCT of the brain is a reliable sign of acute thrombus formation in the intracranial vessels. This sign can present not only in acute ischaemic stroke but also in CVT. Better awareness of this sign in uncommon locations is important, and correct recognition is essential to prevent delays in treatment. However, radiologists and clinicians need to be aware of various potential diagnostic pitfalls.
SMJ-61-237.pdf