

Abstract
INTRODUCTION
We aimed to report the ten-year incidence and trend of sharps injuries and splash exposures (SISE), and analyse the causative instruments and risk factors leading to these injuries to identify potential areas of improvement.
METHODS
A retrospective review of self-reported SISE incidents from 2005 to 2014 was conducted in Singapore General Hospital. Data was extracted from the electronic database of the Department of Infection Prevention and Control. Incidence of SISE was calculated per 1,000 healthcare workers (HCWs) per year.
RESULTS
Over the ten-year period, a total of 1,901 SISE were reported. The average SISE incidence per year was 110.5 per 1,000 doctors and 22.8 per 1,000 nursing staff, with an overall incidence of 28.9 per 1,000 HCWs. The incidence of SISE decreased from 30.3 to 22.0 per 1,000 HCWs per year from 2005 to 2014, while that for splash exposures increased from 1.9 to 3.7 per 1,000 HCWs per year. Doctors reported the highest number of SISE (43.7%), followed by nurses (37.7%). Top mechanisms of injury were intraoperative procedures (22.8%), drawing blood (14.4%) and splash exposures (13.7%).
CONCLUSION
Overall incidence of SISE decreased over the decade. Improved training and increasing use of safety devices, education and awareness could have contributed to the fall in incidence of sharps injuries; these measures should be reinforced and continued. However, the incidence of splash exposures increased over the same period. Preventive measures such as the use of protective goggles and face shields, together with personal protective equipment, should be emphasised and encouraged.
INTRODUCTION
Sharps injuries and splash exposures (SISE) remain occupational hazards for healthcare workers (HCWs) and a major risk of transmission of blood-borne pathogens in hospitals,(1) with seroconversion rates ranging from 0.3%(2) to 5.0% per exposure.(3) In the year 2000, the World Health Organization estimated that 16,000 hepatitis C virus, 66,000 hepatitis B virus and 1,000 human immunodeficiency virus (HIV) infections occurred globally among HCWs due to sharps injuries, resulting in more than 1,000 premature deaths.(4) Additionally, SISE result in significant economic impact directly (e.g. laboratory tests and post-exposure prophylaxis) and indirectly (e.g. loss of work productivity).(5)
The key to the SISE problem is prevention, and there have been many interventions and innovations aimed at reducing SISE. These are mainly derived from root cause analyses of SISE, thus delineating the importance of understanding the risk factors of SISE and continual surveillance of SISE incidence. The majority of sharps injuries are needlestick injuries.(6-8) Major risk factors include recapping of needles and multistep procedures,(6,9) giving rise to preventive countermeasures such as staff education, retractable needles and needleless intravenous (IV) connectors.(10,11)
There are few studies on the incidence of SISE in Singapore, with the latest published by Ng et al in 2002.(12) With the implementation of many interventions and device innovations over the past decade, an updated review of SISE is timely. We aimed to report the ten-year incidence and trend of SISE in a major tertiary hospital in Singapore, and to analyse the contributory factors, causative instruments and risk factors to identify potential areas of improvement.
METHODS
A ten-year retrospective review of self-reported SISE incidents from 2005 to 2014 was conducted in Singapore General Hospital (SGH), with the approval of its institutional review board. Data was extracted from the electronic database of the Department of Infection Prevention and Control. The electronic database was derived from the hospital’s risk management system (RMS), which is the mandatory platform for HCWs to report any workplace-related incidents.
After an SISE incident and immediate medical attention at the staff clinic, it is mandatory for the HCW to file a report in the RMS, describing the mechanism of injury, circumstances leading to the injury and details of the injury (i.e. date, time, location, patient and HCW details, type of sharps/splash exposure, and injury item). Both the staff clinic and RMS would submit a notification of an SISE occurrence to the Department of Infection Prevention and Control. The staff clinic then follows up with the HCW regarding the required blood investigations done and any prophylaxis to be given. Next, the nurses in charge of the Infection Prevention and Control Department collate the cases, contact the HCW involved for further details and give advice to prevent future SISE. They also classify the data collected based on the mechanisms of injury (i.e. intraoperative, drawing blood, splash, transport and disposal, IV/intramuscular [IM] administration, minor procedure, post-procedural clean-up, recapping, housekeeping, others) and devices (for drawing blood: Vacutainer, hypodermic needle, IV stylet, butterfly needle, others). These details are then updated to the electronic database of the Department of Infection Prevention and Control.
Incidence of SISE was calculated per 1,000 HCWs per year. The total number of HCWs per year was obtained from the SGH Human Resource Department and grouped into doctors, nurses, allied health workers (e.g. physiotherapists, pharmacists, laboratory staff), ancillary staff (e.g. cleaners, porters, healthcare assistants, security staff) and trainees (e.g. medical and nursing students). Risk ratio (RR) and 95% confidence interval (CI) for SISE were calculated among personnel, using nurses as the reference group.
RESULTS
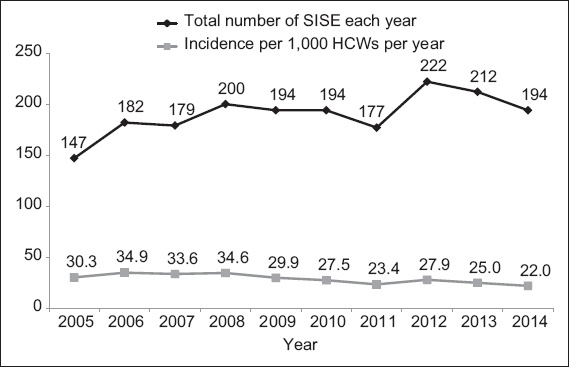
Over a period of ten years, a total of 1,901 SISE incidents were reported across an average number of 6,756 HCWs per year. The mean number of SISE was 28.9 per 1,000 HCWs per year, with a range of 22.0–34.9 per 1,000 HCWs per year and a general decreasing trend across the decade (
Fig. 1
Chart shows the distribution of sharps injuries and splash exposures (SISE) from 2005 to 2014 according to total number per year and incidence per 1,000 healthcare workers (HCWs) per year.
Over the decade, doctors reported the highest number of SISE (n = 830, 43.7%), followed by nurses (n = 716, 37.7%), allied health workers (n = 117, 6.2%), ancillary staff (n = 128, 6.7%) and trainees (n = 110, 5.8%).
Table I
Sharps injuries and splash exposures (SISE) according to category of personnel from 2005 to 2014.
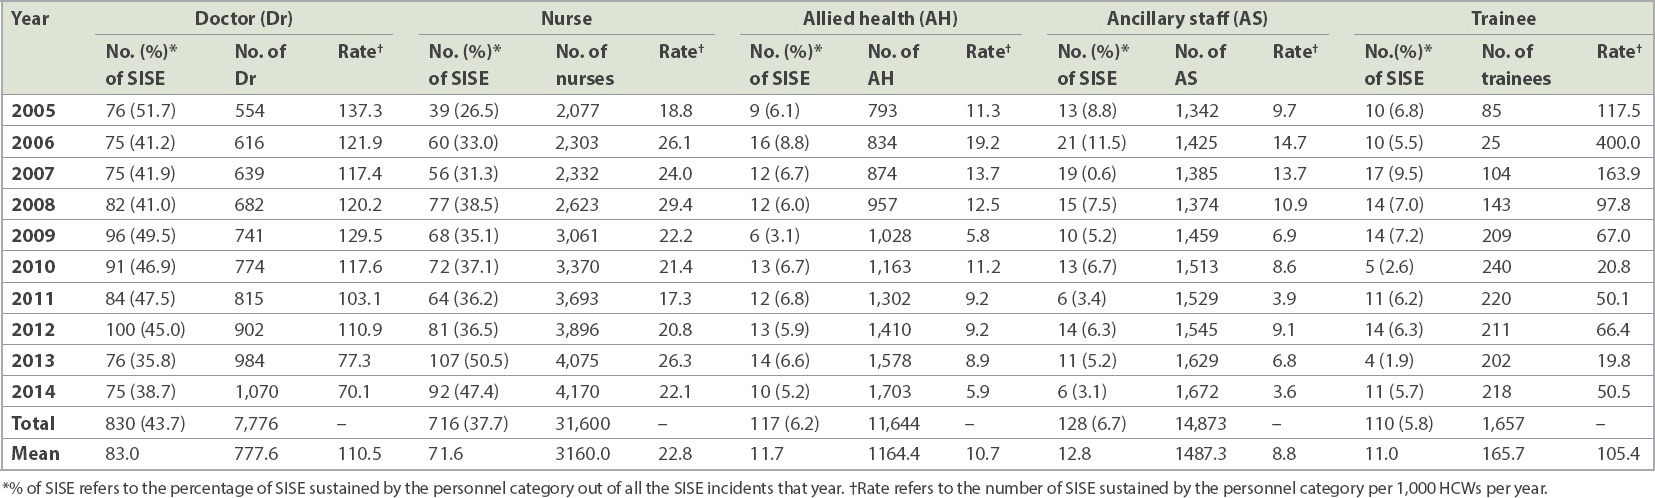
Table II
Incidence of sharps injuries and splash exposures according to mechanisms of injury from 2005 to 2014.*
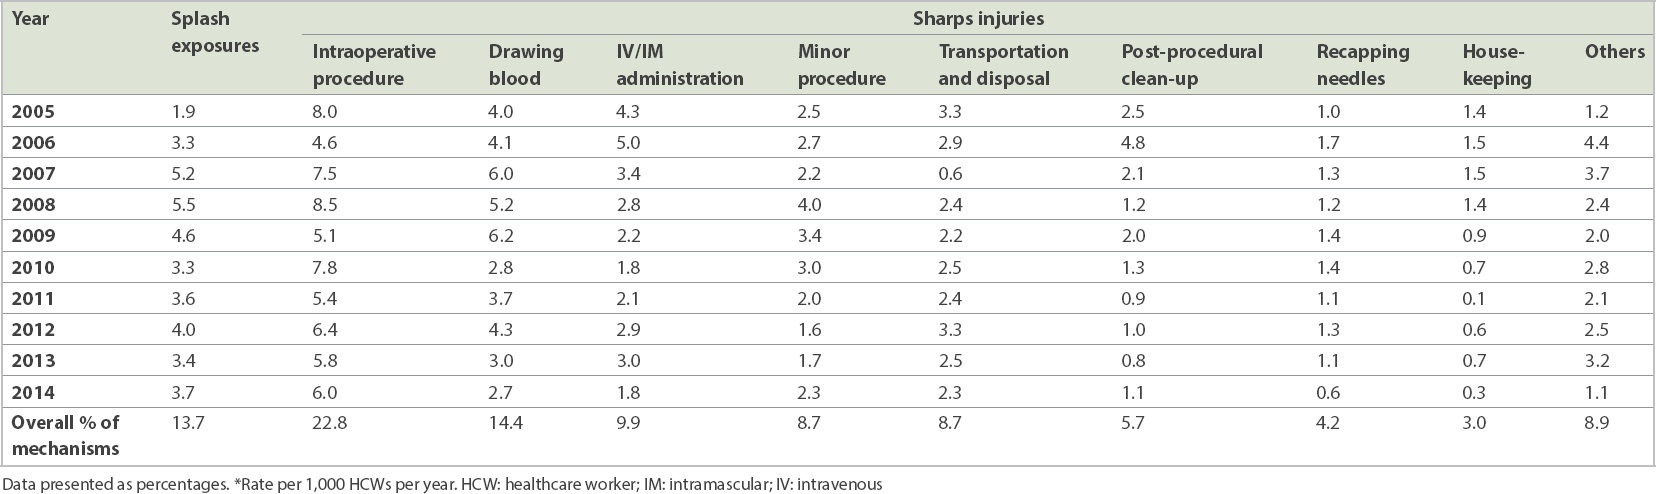
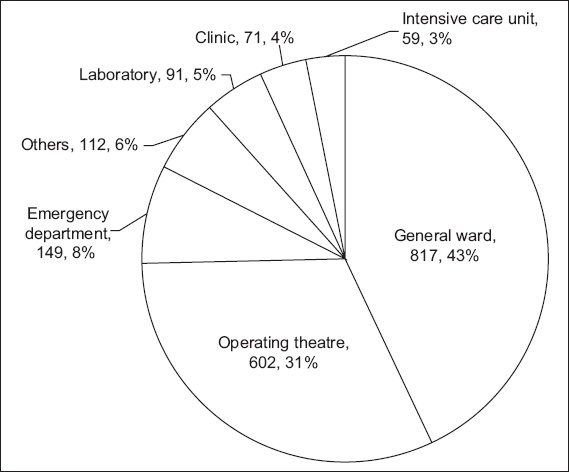
Fig. 2
Pie chart shows the distribution of sharps injuries and splash exposures from 2005 to 2014 based on locations (location, number, overall percentage).
The most common mechanism of injury of SISE was intraoperative procedures, and the majority of the incidents were reported by doctors (n = 269, 62.0%), followed by nurses (n = 149, 34.3%), trainees (n = 12, 2.8%), ancillary staff (n = 2, 0.5%) and others (n = 2, 0.5%). A large proportion of these intraoperative SISE were caused by suture needles (n = 238, 54.8%), with the majority sustained by doctors during suturing. The remaining were from instrument handling during intraoperative procedures, usually from accidental injuries due to unfamiliarity with the instruments (n = 130, 30.0%). Of note, the only area where nurses had a higher incidence of SISE than doctors was during transferring of instruments and needles to and from doctors intraoperatively (nurses: n = 28, 6.5%; doctors: n = 8, 1.8%). Drawing blood was the next most common mechanism of injury of SISE. The majority of these incidents of SISE were sustained while drawing blood using hypodermic needles (n = 195, 71.2%) and butterfly needles (n = 52, 19.0%), whereas the incidence of SISE while using Vacutainer needles (n = 24, 8.8%) and IV stylets (n = 1, 0.4%) was low.
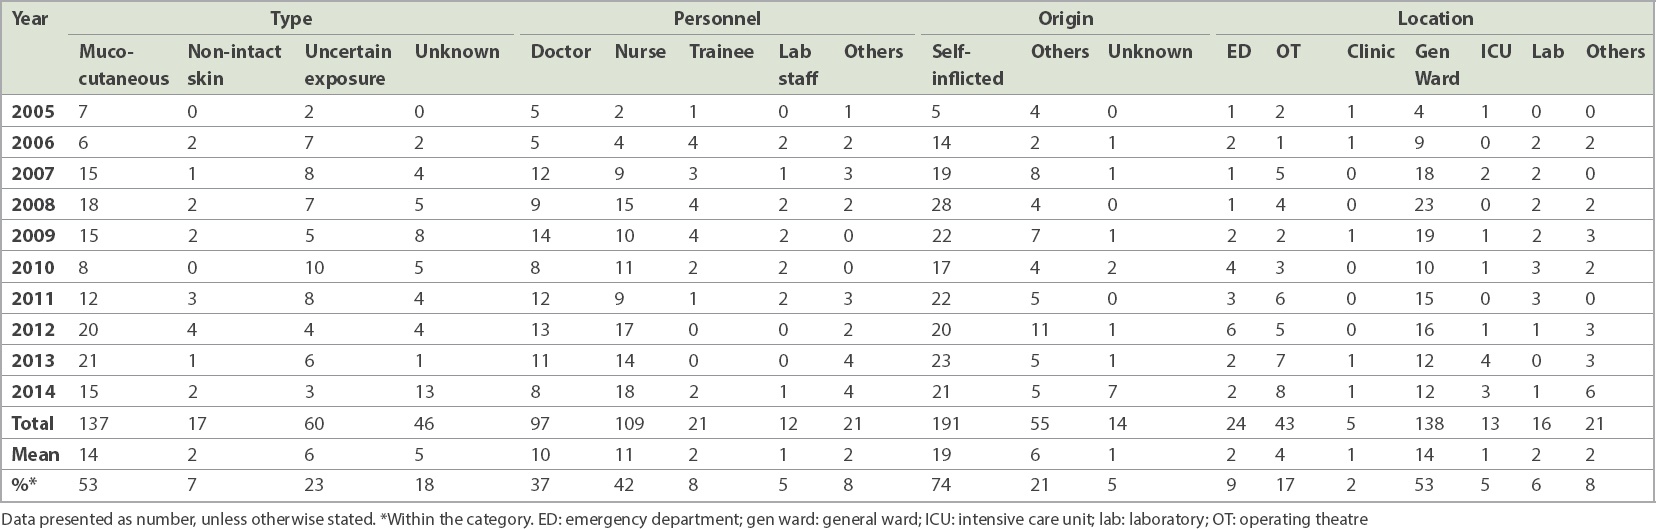
The incidence of splash exposures presented an increasing trend as opposed to the general decreasing trend of SISE from 2005 to 2014 (
Table III
Splash exposures according to type, personnel, origin and location from 2005 to 2014 (n = 260).
DISCUSSION
Sharps injury has been defined by the Centers for Disease Control and Prevention(13) as any penetrating stab wound from a needle, scalpel or other sharp object that may result in exposure to blood or other body fluids. Along with the lesser-reported splash exposures, these unintended injuries can lead to potentially catastrophic consequences for HCWs. Although well recognised as an occupational health hazard, there is little published data describing the current epidemiology of sharps injuries and none on splash exposures in Singapore. The present study aimed to address the current incidence and trend of SISE within a tertiary hospital in Singapore over a period of ten years.
A paper published in 2002 on sharps injury in Singapore revealed an incidence of 11.0 per 100 (i.e. 110 per 1,000) medical staff per year and 6.9 per 100 (i.e. 69 per 1,000) nursing staff per year in a tertiary hospital over a span of three years (1997–2000).(12) Another study, conducted over a span of five years, showed an incidence of 91.7 per 1,000 medical staff per year and 31.1 per 1,000 nursing staff per year, with an overall incidence of 22.4 sharps injuries per 1,000 HCWs per year.(14) Since then, many significant interventions have been implemented and there has been an increasing awareness of the need for prevention of sharps injuries.
Our retrospective study showed an average sharps injury incidence of 97.9 per 1,000 medical staff per year and 19.5 per 1,000 nursing staff per year, with an overall incidence of 25.0 per 1,000 HCWs per year from 2005 to 2014. This is similar to the overall sharps incidence rate previously reported in the 1990s.(14) However, compared to previous studies that reported relatively stable rates among medical staff, our results showed a general decreasing trend of sharps injuries among nurses (from 31.1 to 19.5 per 1,000 nursing staff per year). Unfortunately, due to varied denominators across the worldwide literature,(9) it is difficult to compare the prevalence of SISE with that of other centres. Reported incidence of SISE is also varied, ranging from 14 to 839 needlestick injuries per 1,000 HCWs per year in the United States.(15) Underreporting is always a potential confounder, especially given the restrictions currently in force in Singapore on surgeons with blood-borne viruses. In order to minimise this problem, reporting has been kept confidential. A review of our data also revealed an increased incidence of minor or probable SISE events (as opposed to confirmed obvious needlestick or splash exposure events) being reported in recent years, making underreporting less likely.
In our study, the overall incidence of SISE decreased from 30.3 per 1,000 HCWs per year in 2005 to 22.0 per 1,000 HCWs per year in 2014. The decrease is more pronounced among doctors, from 137.3 per 1,000 doctors per year in 2005 to 70.1 per 1,000 doctors per year in 2014. In addition, the incidence among trainees, ancillary staff and allied health workers has almost halved in the ten years (
Of the different groups of personnel, doctors and trainees were four times more likely to sustain SISE compared to nurses, whereas allied health workers and ancillary staff were two times less likely to sustain SISE. This may be attributable to the higher exposure to SISE and the lower experience of some personnel in the two higher risk groups. Similarly, the incidence of SISE among nurses had not dropped over the decade as compared to the other groups. This may be due to the fact that nurses performed more procedures and venepunctures in the latter years.
Among the different injury mechanisms of SISE, intraoperative sharps injuries were still the leading type of injury (13.2%–28.4% of all injuries over ten years). Although safety protocols and interventions aimed at increasing awareness have been established over the years, the number of intraoperative needlestick injuries remained persistently unacceptable. The majority of needlestick injuries sustained intraoperatively occurred during suturing (n = 238, 54.8%); others involved anaesthetists using local anaesthetic needles and spinal needles (n = 17, 3.9%), and nurses who were accidentally pricked during mounting of suture needles, handling intraoperative instruments and the removal of redivac drains (n = 61, 14.1%). Despite the implementation of protocols for proper passing of instruments, many nurses still sustained needlestick injury during handover of sharps to and from surgeons (doctors: n = 8, 1.8% vs. nurses: n = 28, 6.5%). As such, we should examine in greater detail the types and mechanisms of intraoperative sharps injuries, so as to implement additional interventions to further reduce such risks. Interventions may include continued compulsory education and reinforced awareness of high-risk procedures (such as removal of redivac drain needles, adequate communication during passing of sharps and use of forceps during suturing). Unsurprisingly, mandatory use of improved safety systems targeted at IV/IM administration of drugs and venepuncture has resulted in a reduced proportion and rate of injuries (IV/IM administration from 14.3%, 4.3 per 1,000 HCWs per year in 2005 to 8.2%, 1.8 per 1,000 HCWs per year in 2014; venepuncture from 13.6%, 4.1 per 1,000 HCWs per year in 2005 to 12.4%, 2.7 per 1,000 HCWs per year in 2014). While these used to be the second most common cause of injuries, in recent years, they have dropped to the third or fourth most common cause of injuries among HCWs (
Reports on splash exposures are not commonly published in the literature, as the incidence of seroconversion and risk of transmission are lower than those of needlestick injuries. However, our study showed that the incidence and proportion of splash exposures had increased over the decade (n = 9, 6.1%, 1.9 per 1,000 HCWs per year in 2005 to n = 33, 17.0%, 3.7 per 1,000 HCWs per year in 2014), emerging as the second most prevalent cause of injuries after intraoperative injuries in 2014 (
In conclusion, our study showed that the overall incidence of SISE decreased through the decade despite an increase in the number of HCWs. Improved training, greater use of safety devices, and increased education and awareness may have led to the decrease in sharps incidence; these measures should be reinforced and continued so as to maintain the low incidence of sharps injuries. However, that was not the case for splash exposures, as we saw an upward trend among HCWs, making it the second largest cause of SISE after intraoperative procedures by the end of the decade. Measures to prevent splash exposures such as the use of protective goggles and face shields, together with personal protective equipment, should be emphasised and encouraged.
ACKNOWLEDGEMENT
We would like to acknowledge Dr Hao Ying, Biostatistician from Health Services Research Unit, Division of Medicine, Singapore General Hospital, for her invaluable advice on data analysis for this manuscript.