

Abstract
This pictorial review aims to illustrate the various manifestations of the diabetic foot on magnetic resonance (MR) imaging. The utility of MR imaging and its imaging features in the diagnosis of pedal osteomyelitis are illustrated. There is often difficulty encountered in distinguishing osteomyelitis from neuroarthropathy, both clinically and on imaging. By providing an accurate diagnosis based on imaging, the radiologist plays a significant role in the management of patients with complications of diabetic foot.
INTRODUCTION
Diabetes mellitus (DM) is a growing health problem worldwide. The global prevalence of DM was approximately 5.1% in 2012 and is projected to hit 7.7% by 2030.(1) This is contributed to by the increasingly sedentary lifestyles and evolving dietary trends associated with growing affluence, especially in developed nations. Similar to its geographical extent, DM afflicts the body in a global fashion, resulting in a myriad of complications involving multiple end-organs. In this article, we will consider diabetic foot complications, a significant cause of morbidity and mortality in diabetic patients. Diabetic foot complications comprise pathologies affecting osseous, joint, muscular, tendinous and other soft tissue structures. Infection of the soft tissue and bones is particularly common in the diabetic foot, and early diagnosis is crucial, as it permits timely treatment (e.g. antibiotics, surgical debridement). With delayed treatment and a background of impaired healing, deterioration toward a limb- and life-threatening stage is inevitable.
Almost all diabetic foot infections are due to direct spread from a skin ulcer.(2)The diabetic foot is prone to skin ulceration due to associated risk factors such as microangiopathy with peripheral neuropathy, and altered biomechanics. Unrecognised trauma, in the background of these risk factors, results in superimposed infection and restricts healing.(3,4) Another significant route of infection is related to surgery or penetrating trauma, where infectious material may be directly implanted. Haematogenous spread of infection rarely involves the foot but may be seen in the paediatric population, or with atypical organisms such as Mycobacterium tuberculosis.(5,6) However, in these cases, the clinical diagnosis is straightforward.
Chronic repeated unperceived traumatic injuries to the joints of the foot results in neuroarthropathy (Charcot neuro-osteoarthropathy). The diabetic patient is predisposed to this condition because of associated peripheral neuropathy and peripheral vascular disease. There is progressive arthropathy characterised by cartilage damage, bone erosions, subchondral cysts, joint deformities and new bone formation. This usually affects the tarsometatarsal joints, causing collapse of the longitudinal arch and a ‘rocker-bottom’ deformity that increases load-bearing on the cuboid. Both the acute and chronic forms of neuroarthropathy are recognised.
Neuroarthropathy and osteomyelitis often occur concurrently in the diabetic foot, but either of them may be more prominent. It is clinically and radiologically challenging to distinguish between these two entities. Both conditions may show marrow oedema and enhancement, joint effusion, as well as adjacent soft tissue oedema. Apart from analysing the magnetic resonance (MR) imaging features, correlation with clinical findings is also necessary in order to arrive at an accurate diagnosis.(7,8) In this pictorial review, we illustrate the MR imaging appearances of diabetic foot complications, including osteomyelitis, and also discuss the MR imaging appearance of neuroarthropathy, both with and without coexisting infection.
IMAGING MODALITIES
Radiography is the preferred initial imaging modality, since it is easily available, inexpensive, and provides superb resolution of bones. However, in the case of early osteomyelitis, the rate and accuracy of detection is at best 50%–60%, as the soft tissues are not adequately demonstrated.(9) For the assessment of soft tissue infection and osteomyelitis involving the foot, MR imaging is the modality of choice, with sensitivity and specificity of 90% and 83%, respectively.(10,11) In addition, it allows preoperative mapping of the area of infection, potentially limiting the extent of resection.(12) It has been shown that MR imaging, in combination with radiography, is the most accurate in the detection of diabetic pedal osteomyelitis (and its differentiation from neuroarthropathy).(13-17)
Bone scintigraphy and white cell scintiscans are able to demonstrate increased uptake in osteomyelitis, but they are of limited use due to their poor specificity. Ultrasonography is valuable as a widely available noninvasive imaging modality in the evaluation of soft tissue pathologies and localisation of foreign bodies. However, it has a limited role in the assessment of diabetic foot complications (particularly of the bones).(18)
MR IMAGING PROTOCOL
The MR imaging should ideally be customised to the specific clinical concern. The field-of-view must include the region of interest, with the foot usually divided into forefoot, midfoot or hindfoot regions.(19) A small field-of-view and thin sections optimise spatial resolution, while a large field-of-view sacrifices detail and should be avoided. Nevertheless, the entire foot may be scanned to include the full extent of infection. The foot should be examined clinically prior to MR imaging. If possible, external markers should be positioned over shallow ulcers, which may otherwise be difficult to identify on the images (
Fig. 1
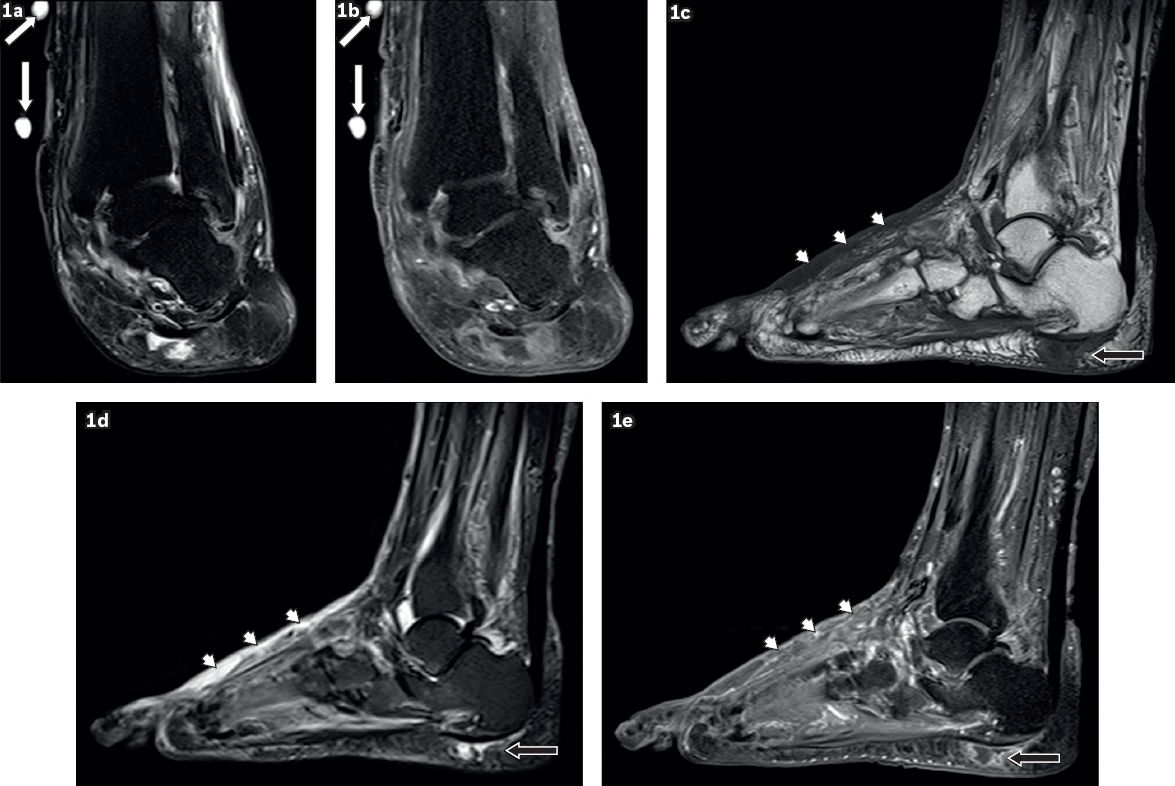
A 59-year-old woman presented with a left ankle ulcer with signs of infection. Coronal (a) T2-W fat-suppressed (FS) and (b) contrast-enhanced T1-W FS MR images of the left ankle show external markers (white arrows), indicating the site of an ulcer along the medial aspect of the distal tibia, evident as a soft tissue defect with focal interruption of the cutaneous line and elevated margins from pre-existing callus formation. High T2-W signal and contrast enhancement at the base of this ulcer are due to granulation tissue. Sagittal (c) T1-W, (d) T2-W FS and (e) contrast-enhanced T1-W FS MR images of the left foot show a focal fluid collection with high T2-W and low T1-W signals in the subcutaneous plane of the heel at the insertion of the Achilles tendon, typical of an adventitial bursa (black arrows). In this case, peripheral enhancement suggests superimposed inflammation/infection. Surrounding cellulitis is present at the dorsum of the foot, seen as areas of T1-hypointense and T2-hyperintense signals within the subcutaneous tissues with enhancement of subcutaneous fat (arrowheads).
T1-weighted (T1-W) sequences depict anatomical detail well. They are sensitive to marrow changes and are the most specific in the detection of osteomyelitis. In addition, T1-W images aid in the identification of blood products. T2-weighted (T2-W) sequences are exquisitely sensitive in the detection of oedema (both bone marrow and soft tissue) and fluid collections. However, with fast spin-echo technique, the bright signal of marrow oedema may be masked by the bright signal of fatty bone marrow, potentially causing diagnostic error. Acquiring T2-W sequences with chemical fat suppression solves this problem; however, to achieve homogeneous fat suppression, the foot has to be positioned in the centre of the magnet. Short tau inversion recovery (STIR) sequence is an alternative, as it gives more uniform fat suppression due to the curvature of the foot, and at the same time remains extremely sensitive to marrow and soft tissue oedema. However, the image resolution is usually less optimal on STIR sequences.
Intravenous gadolinium contrast medium can be given, but its routine use is debatable. Some studies recommend its routine use,(15,20) while others suggest it is unnecessary.(7,21,22) There is no conclusive evidence that intravenous contrast administration increases the accuracy of detection of osteomyelitis, although it certainly improves the evaluation of soft tissue pathology (e.g. abscesses, sinus tracts) and allows distinction between viable and nonviable soft tissue or bone. Hence, it is useful in identifying secondary signs of osteomyelitis and is of value in preoperative planning. In our centre, we routinely acquire post-contrast MR imaging, particularly if abnormal signal is present on routine T1- and T2-W MR imaging.
SOFT TISSUE COMPLICATIONS
Skin callus
Subcutaneous fat is redistributed from the sole of the diabetic foot, changing the biomechanics and leading to skin callus formation at weight-bearing sites.(12) This is exacerbated by friction caused by ill-fitting footwear. In ambulatory patients, skin calluses tend to occur over the metatarsal heads (particularly the first and fifth metatarsals), the tip of the big toe, the distal toes, the tarsometatarsal joints, the cuboid (with the presence of ‘rocker-bottom’ deformity), tendo-Achilles bursa and malleoli.(23,24) In bed-bound patients, as the foot tends to be externally rotated and subjected to longstanding pressure effects, skin calluses have a propensity to occur over the calcaneum and lateral malleolus.
On MR images, skin calluses manifest as focal subcutaneous lesions, showing low T1-W signal intensity and low to intermediate T2-W signal intensity. Enhancement of callus may mimic soft tissue infection, but the characteristic location and paucity of surrounding soft tissue signal change aid in differentiating it from infection. Adventitial bursa formation may occur over the same sites as calluses, since they are both caused by chronic friction. An adventitial bursa is typically seen overlying a bony prominence, appearing as a thin fluid collection with no accompanying subcutaneous inflammatory fat stranding (
Ulcer
Breakdown of a skin callus results in an ulcer. Hence, ulcers are typically preceded by skin calluses. Exceptions include midfoot ulcers in the neuropathic foot and dorsal ulcers in toes with flexion deformities. These may occur without prior callus formation. In diabetic patients, multiple factors contribute to the breakdown of calluses. Sensory neuropathy, the primary contributing factor, results in unperceived trauma, which eventually leads to skin breakdown. Autonomic neuropathy causes skin dryness, which predisposes to fissuring and ulceration. Less commonly, motor neuropathy, which causes atrophy of the anterior calf muscles (foot dorsiflexors) or the intrinsic muscles of the foot, leading to deformities such as hammer toes, prominent plantar metatarsal heads, foot drop and equinus, may be present.(25) These result in pressure points, which give rise to callus and ulcer formation.
On MR imaging, a skin ulcer appears as a local disruption of the cutaneous line, with associated raised margins (secondary to pre-existing callus formation) and soft tissue defects. Acute ulcers may demonstrate high T2-W signal intensity and peripheral enhancement, suggestive of granulation tissue at the ulcer base (
Cellulitis
Cellulitis refers to an acute non-necrotising inflammatory process involving the skin and subcutaneous tissue but spares the deep fascia and muscles. Clinically, there is soft tissue swelling, localised pain and tenderness, erythema and warmth, features that can be confused with or masked by oedematous change secondary to acute neuropathy.(4)
On MR imaging, cellulitis appears as loss of the normal subcutaneous fat signal intensity on T1-W images, with associated increased T2-W signal intensity and diffuse enhancement with intravenous gadolinium.(16,26) The margins are typically ill defined. Cellulitis and acute neuropathy may appear similar on MR imaging, with skin thickening and more prominent reticulation of fat.(27) However, enhancement is characteristic of cellulitis and typically not present in oedema of neuropathic disease (Figs.
Fig. 2
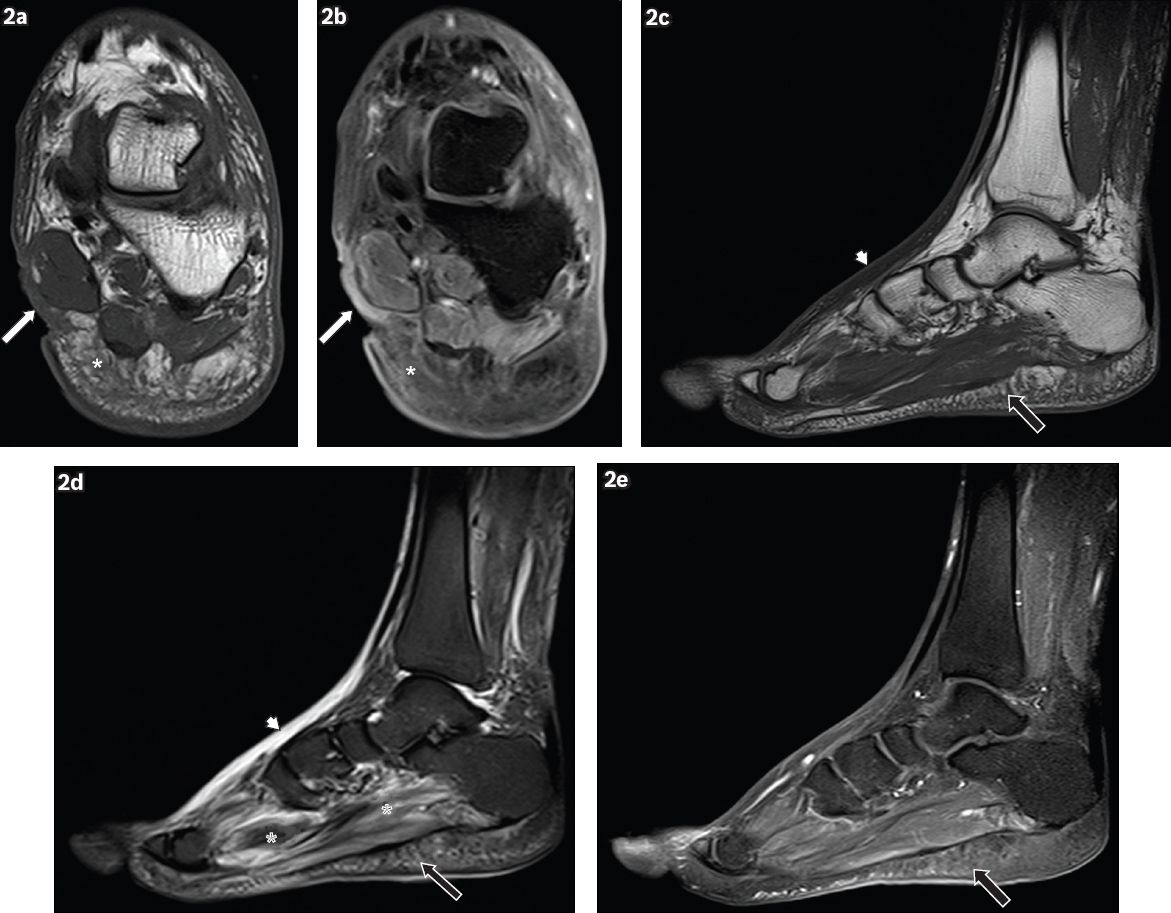
A 62-year-old man presented with a wound on the medial aspect of the left hindfoot, sustained one month earlier, with pus discharge and surrounding inflammation. Coronal (a) T1-W and (b) contrast-enhanced T1-W FS MR images of the left hindfoot show an ulcer (white arrows) on the medial aspect of the hindfoot, seen as a soft tissue defect with focal interruption of the cutaneous line. Enhancing granulation tissue is noted at the base of the ulcer and surrounding cellulitis is present (white asterisks), seen as areas of T1-hypointense signal within the subcutaneous tissues, with prominent reticulation and enhancement of subcutaneous fat. Sagittal (c) T1-W, (d) T2-W FS and (e) contrast-enhanced T1-W FS MR images of the left foot show reactive subcutaneous oedema at the dorsum of the foot (arrowheads), which shows low T1-W and high T2-W signals, similar to those for cellulitis. However, no significant enhancement is seen, distinguishing it from cellulitis. Mild cellulitis is noted in the sole (black arrows), with T1 hypointensity, T2 hyperintensity and mild enhancement in the subcutaneous tissues. Increased T2-W signal in the plantar muscles is characteristic of myositis (black asterisks).
Abscess and sinus tract
Abscess formation can occur with chronic infections, or may be seen early in aggressive infections. Between 10%(16) and 50%(29) of patients with pedal infection show MR imaging evidence of abscesses. An abscess manifests as a rim-enhancing collection of fluid signal intensity(28) (
Fig. 3
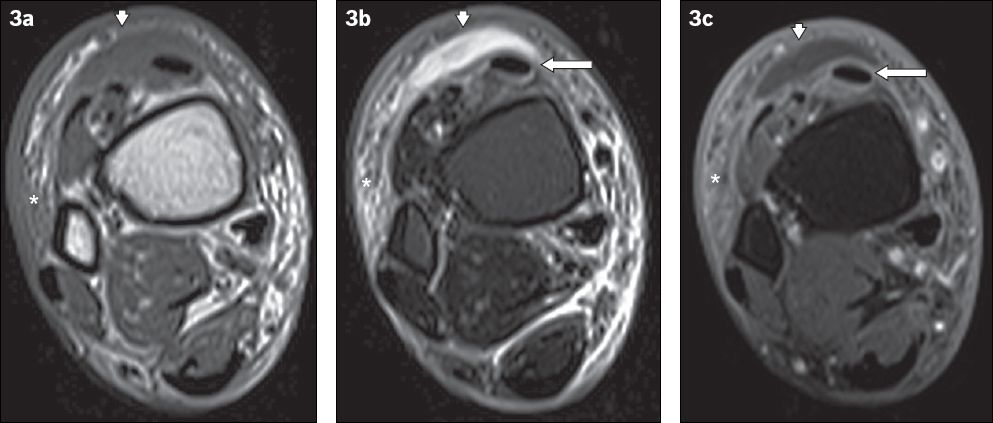
A 60-year-old man presented with fever and painful swelling over the anterior aspect of the right ankle. Axial (a) T1-W, (b) T2-W FS and (c) contrast-enhanced T1-W FS MR images of the right distal leg show a crescent-shaped T1-hypointense and T2-hyperintense fluid collection, with mild peripheral contrast enhancement anterior to the extensor tendons of the foot, consistent with a subcutaneous abscess (arrowheads). Surrounding cellulitis is observed, evident as areas of T1-hypointense and T2-hyperintense signals within the subcutaneous tissues with enhancement of subcutaneous fat (asterisks). Peritendinous high T2-W signal and enhancement involving the tibialis anterior and other extensor tendons is in keeping with tenosynovitis (arrows).
The majority of abscesses are small, and in the absence of contrast administration, may be easily masked by surrounding soft tissue oedema.(28) Hence, in the setting of infection, contrast administration is essential to aid abscess identification and show the extent of soft tissue infection. Sometimes, despite contrast administration, the abscess may lie in such close proximity to the skin that its enhancing rim is not discernible.
Abscesses are frequently contiguous with sinus tracts that communicate with skin ulcers, tendon sheaths, bones or joints. On post-contrast MR images, sinus tracts show a ‘tram-track’ pattern of enhancement.(15,30) Sinus tracts require imaging evaluation in all planes – a sinus tract with a tortuous course may be erroneously labelled as an abscess, since it may appear circular in cross-section in a single plane (
Fig. 4
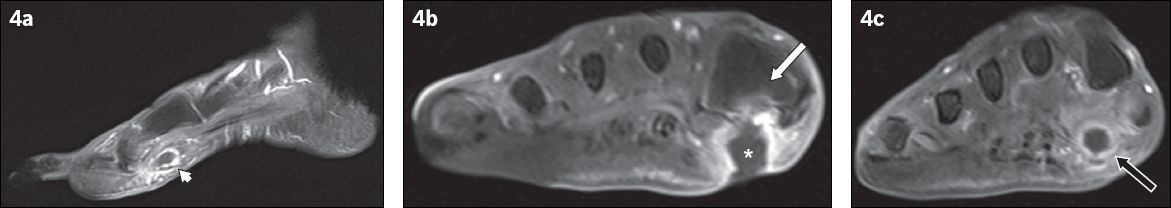
A 79-year-old woman presented with fever and symptoms of right foot infection. (a) Sagittal contrast-enhanced T1-W FS MR image of the right foot shows the ‘tram-track’ pattern of enhancement of a sinus tract in the subcutaneous layer of the plantar forefoot (arrowhead). (b& c) Coronal contrast-enhanced T1-W FS MR images of the right foot taken at two separate locations. (b) The sinus tract extends to a subcutaneous abscess (asterisk), adjacent to the base of the first metatarsal and with an overlying skin ulcer. The adjacent bone marrow enhances, suggesting osteomyelitis (white arrow). (c) Further distally in the right forefoot, the cross-sectional appearance of the sinus tract is demonstrated as a round rim-enhancing fluid collection, which may be mistaken for an abscess if not evaluated properly (black arrow).
Gangrene
Gangrene refers to soft tissue necrosis. In diabetic patients, microvasculopathy causes ischaemia, which may in turn lead to gangrene. Most cases of gangrene are diagnosed clinically. The purpose of contrast-enhanced MR imaging is usually to delineate areas of soft tissue necrosis, which aids surgical planning.(31) Gangrene is classified as either dry or wet, based on the absence or presence of infection, respectively. In wet gangrene, soft tissue gas due to infection by gas-forming bacteria may be present. In such cases, there is usually rapid spread of infection and urgent surgical treatment is often necessary.
On post-contrast MR imaging, gangrene is seen as an area of unenhanced devitalised soft tissue that has a well-defined border with adjacent viable soft tissue. Reactive hyperaemia and enhancement may be present at the margins of the devitalised tissue.(31) Necrotic tissue may liquefy, resulting in fluid signal intensity on MR imaging.
Gas associated with wet gangrene can be difficult to see on MR imaging, as it is found within fascial layers, which normally show low MR imaging signal intensity similar to gas. Gradient-echo sequences have the highest sensitivity in the detection of soft tissue gas, which causes prominent blooming artefact (
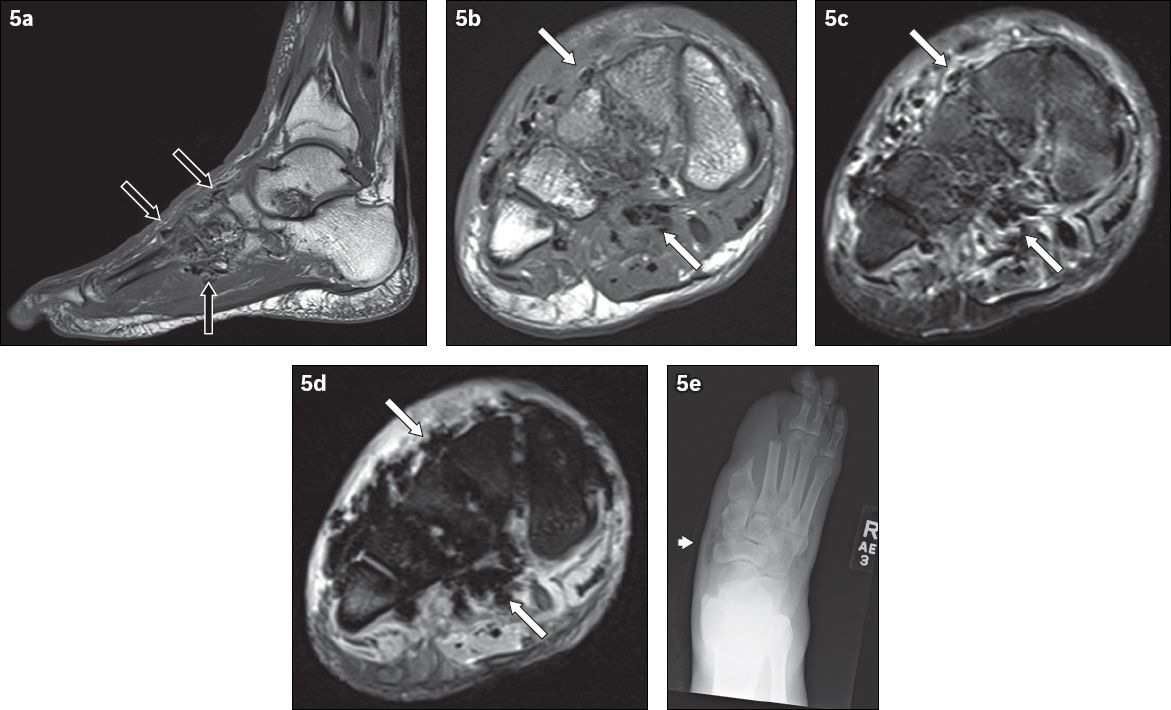
Fig. 5
A 62-year-old man presented with the clinical diagnosis of wet gangrene of the right foot. Signs of infection and crepitation were elicited on examination of the right foot. (a) Sagittal T1-W MR image of the right foot shows low signal foci of magnetic susceptibility along the fascial planes in the midfoot (black arrows), in keeping with soft tissue gas. Axial (b) T1-W, (c) T2-W FS and (d) gradient-echo MR images of the right midfoot show soft tissue gas, seen as low signal foci of magnetic susceptibility (white arrows). The gradient-echo sequence is very sensitive in the detection of gas – the magnetic susceptibility caused by gas manifests as blooming artefacts on this MR imaging sequence, making them more conspicuous. (e) Frontal radiograph of the right foot, obtained at the same time, reveals lucencies in the soft tissues of the midfoot (arrowhead), in keeping with gas and corresponding to the MR imaging appearances. The patient was status post partial amputation of first and second rays.
Foreign body
Patients with sensory neuropathy secondary to DM are predisposed to unperceived foreign body penetration of the foot. Foreign bodies are usually located under the metatarsal heads. They may also be seen after surgery. MR images should be scrutinised for a foreign body whenever there is soft tissue infection but no accompanying skin ulcer.
A foreign body is typically hypointense on both T1- and T2-W sequences, and may show blooming artefact on gradient-echo sequences.(19) Granulomatous reaction results in peripheral enhancement, which should not be misinterpreted as an abscess.(33) T2-W sequences help to differentiate an abscess from a foreign body, since the former contains fluid (T2-hyperintense), while the latter does not.
BONE/JOINT COMPLICATIONS
Osteomyelitis
At presentation, clinical findings of infection are seen in more than 50% of diabetic patients with skin ulcer of the foot. Depending on the severity, between 20% and 60% of these infections are accompanied by bone infection.(34-36) The easiest way to detect osteomyelitis on MR imaging is to follow the path of the skin ulcer or sinus tract to the bone and assess the marrow signal intensity (Figs.
Fig. 6
A 60-year-old man presented with a chronic ulcer on the lateral aspect of the right heel, with symptoms of infection. Axial (a) T1-W, (b) T2-W FS and (c) STIR MR images of the right foot show an ulcer (white arrows) along the lateral aspect of the heel with surrounding cellulitis (arrowheads). Low T1-W and high T2-W marrow signals in the adjacent calcaneum, with associated cortical ill-definition, suggest osteomyelitis (asterisks). Notice also the reactive myositis involving the interosseous muscles, seen as high signal on T2-W FS and STIR sequences (black arrows). High T2-W signal in the visualised proximal phalanges on the T2-W FS image (b) is due to failure of fat suppression (thin arrows), a potential pitfall in MR imaging. The corresponding areas on the STIR sequence (c) show better fat suppression, with appropriate signal drop-out of normal marrow (broken arrows).
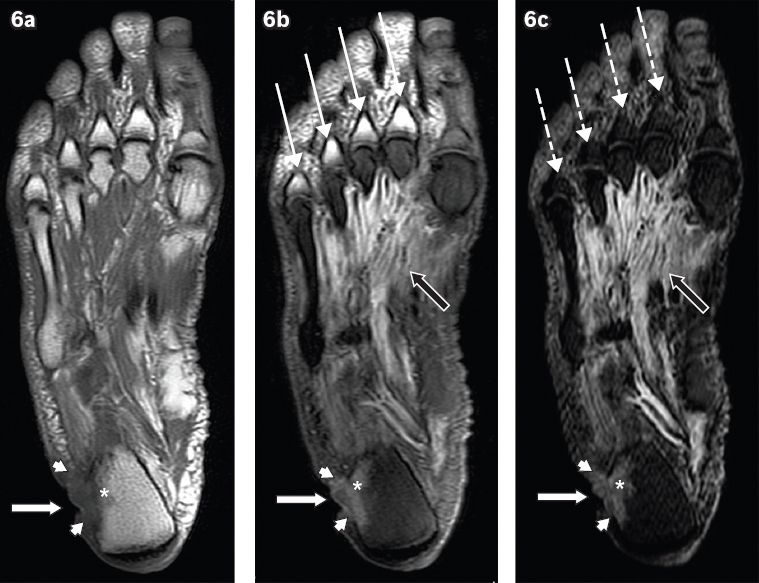
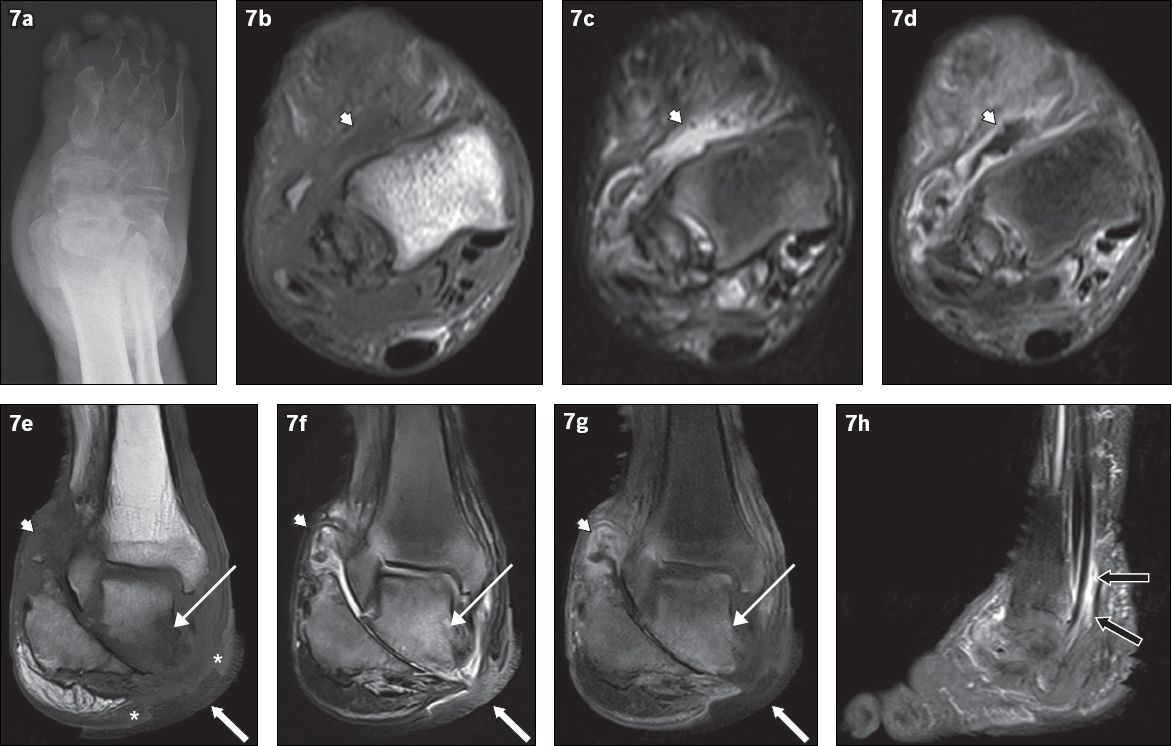
Fig. 7
An 81-year-old man presented with a chronic nonhealing right heel ulcer with foul-smelling discharge and surrounding inflammation. (a) Frontal radiograph of the right foot shows changes of chronic neuroarthropathy, with bony resorption of the proximal phalanges and metatarsals, and disorganisation of the subtalar and intertarsal joints. Axial (b) T1-W, (c) T2-W FS and (d) contrast-enhanced T1-W FS, and coronal (e) T1-W, (f) T2-W FS and (g) contrast-enhanced T1-W FS MR images of the right foot are shown. Chronic neuroarthropathy is most strikingly illustrated by disruption of the subtalar joint, seen on the coronal images. An ulcer is present on the medial aspect of the hindfoot (white arrows), with the disrupted subtalar joint deep to it. Fluid collections are seen lining the ankle and subtalar joints, showing high T2-W and low T1-W signals with associated synovial outpouchings and contrast enhancement, consistent with synovitis (arrowheads). In isolation, these imaging findings cannot distinguish septic arthritis or superimposed infection from pure neuroarthropathy. However, in this case, there is an area of marked low T1-W signal involving the inferior and medial portions of the talus with high signal on post-contrast and T2-W images (thin arrows), suggesting superimposed osteomyelitis and the presence of infection. The ‘ghost sign’ is present, with the involved bones more clearly delineated on the T2-W FS and contrast-enhanced T1-W FS images, compared to the T1-W sequence (in which the bones ‘disappear’). In addition, the absence of adjacent subcutaneous fat signal intensity is suggestive of superimposed infection (asterisks). (h) Sagittal contrast-enhanced T1-W FS MR image of the right foot shows peritendinous contrast enhancement along the tibialis posterior, flexor digitorum longus and flexor hallucis longus tendons, suggestive of tenosynovitis (black arrows).
Osteomyelitis should not be confused with osteitis, which refers to reactive marrow changes secondary to a neighbouring infection (of soft tissue or cortical bone). On T2-W images, osteitis appears as hyperintense marrow, which is identical to that seen in osteomyelitis. However, on T1-W images, it does not demonstrate the low signal that characterises osteomyelitis. Bone marrow enhancement may be seen but is not reliable in discriminating between the two entities.(12)
MR imaging evaluation of the postsurgical diabetic foot is commonly performed, and the same principles apply when determining the presence of osteomyelitis at an amputation site.(19) In the case of debridement, postsurgical marrow oedema may be present and should not be misinterpreted as osteomyelitis. The majority of amputations show minimal postsurgical marrow oedema.
Neuroarthropathy
Neuroarthropathy is an uncommon but severe complication of diabetic peripheral neuropathy, which is estimated to affect between 0.8% and 8.0% of the diabetic population.(37) A higher proportion of cases are found when advanced imaging studies are utilised for diagnosing foot problems, and the incidence of neuroarthropathy appears to be increasing.(37,38) In the acute stage, neuroarthropathy is treated by immobilisation and pressure off-loading, usually with concomitant pharmacotherapy (e.g. oral/intravenous bisphosphonates, nasal calcitonin). In the complicated diabetic foot, it is often difficult to differentiate osteomyelitis and neuroarthropathy, especially at initial presentation. Since their management is significantly different and largely determines patient outcome, it is important for clinicians and radiologists to know how to diagnose these conditions.
It may be challenging to distinguish early neuroarthropathy from osteomyelitis on clinical examination, bone scintiscans and MR imaging. During the early phases of neuroarthropathy, when radiographs are normal, MR imaging may show soft tissue oedema, joint effusions, fluid collections and abnormal marrow signal intensity.(7,39) Post-contrast MR imaging reveals enhancement of the marrow and periarticular soft tissue(40) (
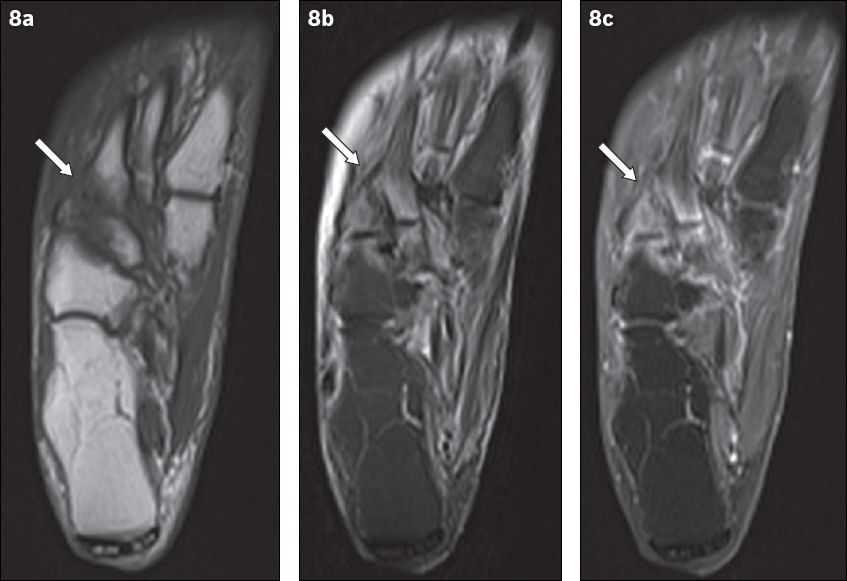
Fig. 8
An 81-year-old woman presented with tenderness over the dorsum of the right foot, with associated inflammatory skin changes. Axial (a) T1-W, (b) T2-W FS and (c) contrast-enhanced T1-W FS MR images of the right foot show periarticular high T2-W signal with corresponding enhancement, centred around the tarsometatarsal joints (arrows). The typical location, coupled with the absence of other secondary soft tissue signs of infection (e.g. ulcer, cellulitis, abscess, sinus tract), indicated the diagnosis of acute neuroarthropathy. The patient was given analgesia for symptomatic treatment and her symptoms subsequently resolved.
Differentiating osteomyelitis from neuroarthropathy
While neuroarthropathy is primarily articular, osteomyelitis virtually always occurs by direct extension from skin ulcers at typical sites. The presence of marrow oedema and periarticular disease with no adjacent ulcer is highly suggestive of neuroarthropathy. Superimposed osteomyelitis usually shows diffuse marrow changes, whereas neuroarthropathy often shows periarticular marrow changes, since the pathology centres on the joint (
Neuroarthropathy with superimposed infection
In the presence of skin ulceration extending to the bone, patients with pre-existing neuroarthropathy more commonly have osteomyelitis compared to patients without. Although the specificity of MR imaging in detecting osteomyelitis may be limited by pre-existing neuroarthropathy, in such cases, MR imaging is mainly used to assess disease extent rather than establish the diagnosis.(41) Post-contrast MR imaging is recommended for the evaluation of soft tissue disease extent.(10)
Several imaging features help differentiate neuroarthropathy with superimposed infection from uncomplicated neuroarthropathy. In superimposed joint infection, soft tissue features that may be seen include a loss of fat signal intensity in the adjacent subcutaneous tissue (Figs.
Fig. 9
A 49-year-old man presented with low-grade fever and signs of right foot infection. Sagittal (a) T1-W, (b) T2-W FS and (c) contrast-enhanced T1-W FS MR images of the right foot show extensive bony destruction centred around the midfoot joints, consistent with chronic neuroarthropathy. This is well demonstrated on the accompanying (d) oblique radiograph of the right foot. On the MR images, abnormal marrow signal is seen diffusely in the bones of the midfoot, extending beyond the subchondral bone; the affected bones show marked low T1-W signal and corresponding high T2-W signal as well as enhancement (arrows). The ‘ghost sign’ is present, with better delineation of the involved bones on the T2-W FS and contrast-enhanced T1-W FS images, compared to the T1-W image (in which the bones ‘disappear’). MR imaging appearances suggest osteomyelitis. Secondary signs of infection are present, with a rim-enhancing abscess tracking into the intertarsal joints and extending to the subcutaneous layer via a sinus tract (thin arrows). Surrounding soft tissue enhancement and the absence of subcutaneous fat signal intensity are noted (asterisks). There is suggestion of a sequestrum (arrowhead).
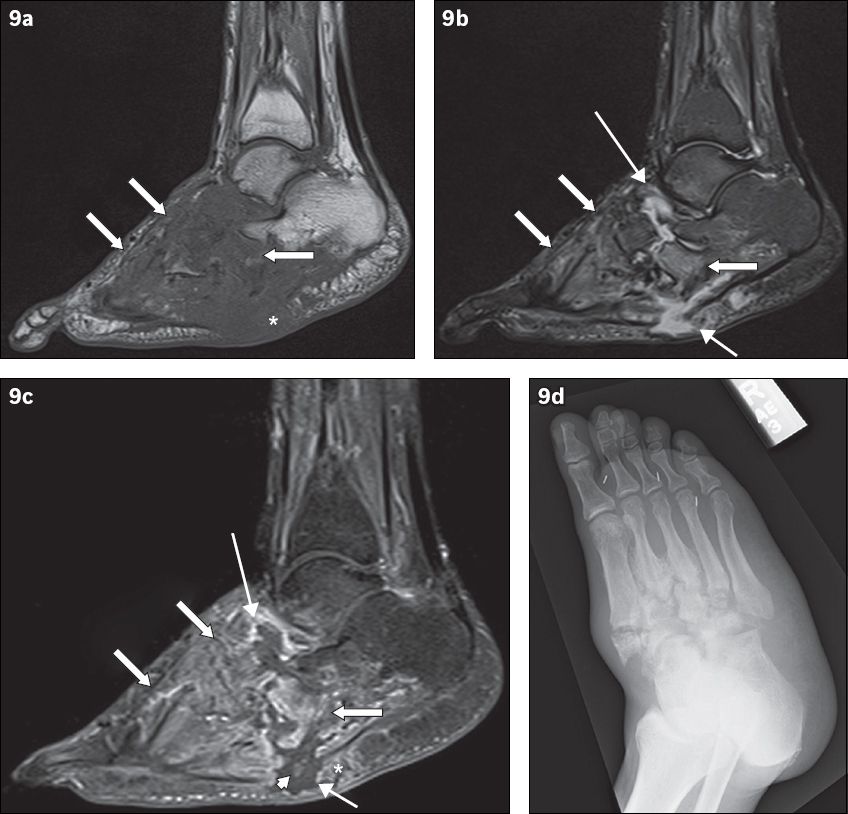
The ‘ghost sign’ is another useful feature that distinguishes uncomplicated neuroarthropathy from infected neuroarthropathy. The presence of the ghost sign points toward superimposed infection, while its absence excludes superimposed infection. The ghost sign refers to bones that ‘disappear’ on T1-W sequences and ‘reappear’ (become better delineated) on T2-W or post-contrast sequences(12) (Figs.
Septic arthritis
Septic arthritis in the diabetic foot is typically a result of direct spread from soft tissue infection.(23,42) Septic arthritis from haematogenous spread is slightly more common in diabetic patients than in the nondiabetic population. Nevertheless, most cases of septic arthritis in the diabetic foot are due to direct contiguous spread. Frequently, involved joints lie adjacent to the typical sites of skin callus or ulceration, which includes the ankle, subtalar, metatarsophalangeal and interphalangeal joints, and midfoot joints in the presence of background neuroarthropathy. Midfoot septic arthritis presents the greatest diagnostic challenge, since its imaging appearance can be almost identical to that of midfoot neuroarthropathy (
On MR imaging, complex joint effusion with marked synovial enhancement is seen. Thickening and outpouchings of the synovium frequently occur. Contiguous extension of joint fluid to an adjacent sinus tract may be seen; in such cases, due to decompression, the joint effusion may become smaller at subsequent imaging even with persisting septic arthritis. There may be perisynovial oedema of the surrounding soft tissue, as well as reactive subchondral marrow oedema with marginal erosion.(43) It is crucial to differentiate between reactive marrow changes and superimposed osteomyelitis. The former usually shows a thin band of subchondral marrow oedema, while the latter more commonly demonstrates marrow oedema extending proximally beyond the subchondral bone with marked hypointense marrow signal on T1-W images.(44)
MUSCULOTENDINOUS COMPLICATIONS
Tenosynovitis
Septic tenosynovitis typically occurs next to an ulcer or sinus tract due to local extension of infection. Most cases of septic tenosynovitis involves the peroneal tendons (adjacent to lateral malleolus skin ulceration) and the Achilles tendon (adjacent to calcaneal skin ulceration).(12) In the forefoot, almost two out of three cases of tenosynovitis affect the flexor tendons, as a consequence of plantar skin ulcers.
On MR imaging, tenosynovitis is suggested by peritendinous enhancement within a region of cellulitis and associated with an infected skin ulcer(45) (Figs.
A fluid-distended tendon sheath can also be seen in tenosynovitis, with the signal intensity of the fluid varying depending on its contents (e.g. the presence of debris, gas or blood). Fluid within a tendon sheath can be a normal finding, or may be seen in noninfective pathologies such as traumatic and mechanical conditions. However, fluid within the anterior tendon sheaths is considered neither normal nor caused by a mechanical condition.(12)
Denervated muscle
Patients with DM are predisposed to peripheral neuropathies, which can eventually lead to denervation of muscle. In the acute phase, muscle denervation may not show any abnormality on MR imaging. In the subacute phase, diffuse oedema is seen in the affected muscle, which appears hyperintense on T2-W and inversion recovery sequences. This finding is typically not seen on MR imaging for up to about two to four weeks after the onset of muscle denervation.(46)
Timely restoration of muscle innervation may lead to reversal of changes. Otherwise, irreversible chronic atrophy with associated infiltration of fat may result.(26) On MR imaging, a larger amount of fat (with typical high T1-W signal intensity) is seen within the involved muscle bellies, with corresponding reduced muscle bulk. In the evaluation of chronic muscle denervation, T1-W sequences are more dependable, as variable appearances can be seen on T2-W and inversion recovery sequences.(46)
Bacterial myositis/pyomyositis
Myositis may be reactive (inflammatory) or bacterial (infective), and is frequently seen in association with other signs of soft tissue infection (Figs.
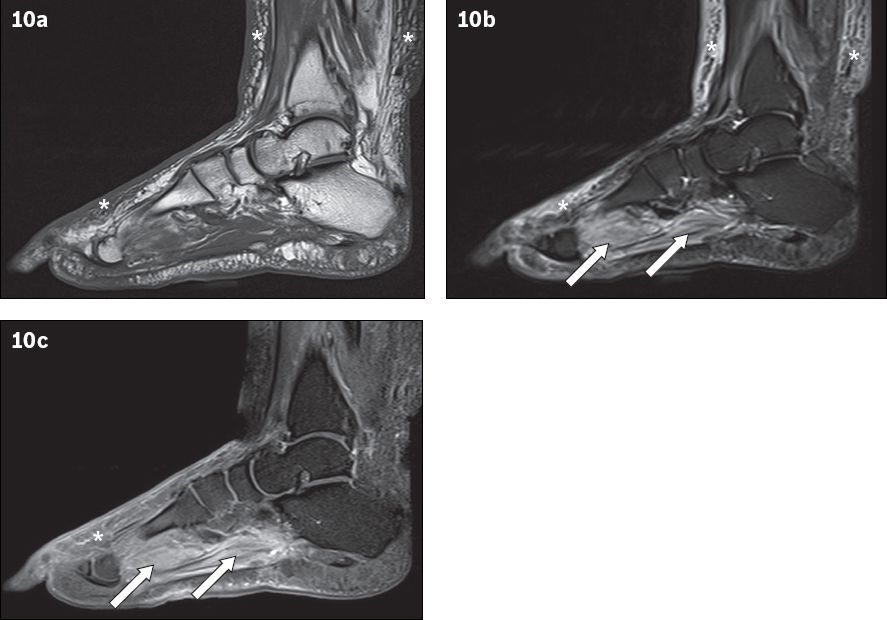
Fig. 10
A 66-year-old man presented with fever and right lower limb cellulitis. Sagittal (a) T1-W, (b) T2-W FS and (c) contrast-enhanced T1-W FS MR images of the right foot show increased reticulation of the subcutaneous fat of the lower leg and foot, with corresponding high T2-W signal and enhancement, in keeping with cellulitis (asterisks). Increased T2-W signal with associated enhancement is also seen in the plantar muscles of the foot, suggestive of myositis (arrows). No rim-enhancing fluid collection is seen within the affected muscles to suggest an abscess/pyomyositis. The bones show normal marrow signal, which excludes osteomyelitis.
Bacterial myositis may be secondary to contiguous spread of infection from adjacent tissues (e.g. subcutaneous abscess and osteomyelitis). It commonly leads to intramuscular abscess formation, i.e. pyomyositis.(47) In pyomyositis, focal rim-enhancing lesions can be seen on a background of diffuse high T2-W signal (oedema), with associated irregular enhancement of the deep fascia.(48)
CONCLUSION
MR imaging is increasingly available and currently the imaging modality of choice in the assessment of osteomyelitis and soft tissue complications in the diabetic foot. Due to the myriad manifestations and at times overlapping features of these complications, diagnosis via MR imaging can be challenging. It was the objective of this article to illustrate the MR imaging appearances and provide a strategy in the interpretation of MR images of diabetic foot complications. Familiarity with the specific technical requirements of MR imaging and the imaging features of these conditions will enable the radiologist to contribute significantly to patient management.