

Abstract
INTRODUCTION
Metabolic heterogeneity among obese individuals is thought to translate into variations in cardiovascular risk. Identifying obese people with an unfavourable metabolic profile may allow preventive strategies to be targeted at high-risk groups. This study aimed to identify clinical, biochemical and immunological differences between insulin-sensitive and insulin-resistant obese subgroups, to understand the population-specific pathophysiological basis of the adverse cardiovascular risk profile in the latter group.
METHODS
Cardiovascular risk indicators, including anthropometric parameters, blood pressure, acanthosis nigricans area, and related biochemical, endocrine and inflammatory markers, were determined in 255 healthy South Asian volunteers aged 18–45 years, with a 2:1 ratio of obese/overweight to normal-weight individuals. Lifetime atherosclerotic cardiovascular disease (ASCVD) risk was also calculated.
RESULTS
Body mass index (BMI) and insulin sensitivity-based tertiles independently showed incremental trends in waist-hip ratio, skinfold thickness, acanthosis nigricans area, blood pressure, serum lipids, hepatic enzymes, adipokines, inflammatory markers and ten-year ASCVD risk. The anthropometric, biochemical and inflammatory parameters of obese insulin-sensitive and obese insulin-resistant groups differed significantly. Extreme group analysis after excluding the middle tertiles of both insulin resistance and BMI also showed significant difference in anthropometric indicators of cardiovascular risk and estimated lifetime ASCVD risk between the two obese subgroups.
CONCLUSION
Obese insulin-sensitive individuals had a favourable metabolic profile compared to the obese insulin-resistant group. The most consistent discriminative factor between these phenotypic classes was anthropometric parameters, which underscores the importance of clinical parameters as cardiovascular risk indicators in obesity.
INTRODUCTION
The world is experiencing an obesity pandemic. In 2016, 1.9 billion adults worldwide were estimated to be overweight (body mass index [BMI] > 25 kg/m2).(1) Of these, one-quarter were from developing countries traditionally burdened by famine and under-nutrition, raising the two-headed threat of both under- and over-nutrition and affecting economies already reeling under the burden of infectious diseases. Epidemiological evidence indicates that obesity is associated with increased mortality and morbidity due to illnesses such as Type 2 diabetes mellitus, hypertension and cardiovascular disease. This association is reflected in definitions of metabolic syndrome, which is thought to affect a quarter of the world’s population according to estimates by the International Diabetes Federation.(2) Obesity, the health challenge of our times, is poised to spiral out of control if immediate and effective steps are not taken by healthcare services around the world. With the obese population numbering in the billions, questions need to be asked: can every obese person be treated, and perhaps more importantly, should everyone be treated? The answer to the first question is clearly negative, but the second question poses a challenge, especially with an increasing body of evidence that divides obesity along phenotypic and metabolic lines.
In studies that stratified populations by BMI, a trend of increasing mortality was seen at either extreme of the curve, with the nadir of the curve (representing the ideal BMI) at 22–27 kg/m2, depending on the population studied.(3-6) This J- or U-shaped curve challenges the concept that a lower BMI is always better. Moreover, the flattened base of the curve shows that for a considerable range of BMI values, there is no significant change in mortality with increasing BMI.(6) While evidence for an association between obesity and atherosclerotic cardiovascular disease (ASCVD) is unambiguous, epidemiological studies on risk factors for ASCVD do not necessarily support the BMI trend. In the National Health and Nutrition Examination Survey (NHANES), a quarter of apparently healthy, normal-weight adults had one or more cardiovascular risk factors; conversely, one-third of obese but otherwise healthy individuals had no cardiovascular risk factors.(7) This lends weight to the clinical observation that not every obese person goes on to develop diabetes or other obesity-related diseases.
In an attempt to identify the underlying cause of this difference in the clinical course of obesity, Stefan et al looked at differences in insulin sensitivity in different subsets of obese individuals and found that while more than 75% obese individuals were insulin resistant, up to a quarter were insulin sensitive. The authors categorised these insulin-sensitive obese individuals, who could be considered to have a relatively benign phenotype, as having metabolically benign obesity.(8) As both insulin sensitivity and adiposity have been shown to be associated with variations in activation of cellular and humoral mediators of inflammation and adipokine production,(9-11) it is possible that the underlying pathogenic difference between these obesity phenotypes (defined by variations in insulin sensitivity and metabolic risk) lies in the degree of inflammation or adipokine production. Stratification of obesity based on metabolic risk must, therefore, take into account the status of these inflammation pathways.
South Asians represent a unique population with regard to their relatively adverse obesity-related metabolic outcomes. This research was designed to study phenotypic, biochemical and immunological variations among obese South Asian individuals in order to better understand why some obese individuals have a seemingly adverse metabolic profile compared to others. In particular, we were interested in finding out if a metabolically benign form of obesity was also demonstrable amongst healthy South Asians with their well-documented adverse cardiometabolic risk profile. We hypothesised that obese insulin-sensitive South Asian individuals are characterised by a relatively benign metabolic phenotype and differ from those considered to have metabolically unhealthy obesity (MUO), with respect to clinical and biochemical cardiovascular risk indicators, as well as inflammatory profile and adipokine levels.
METHODS
The study was registered with the Services Hospital research registry (36/src/dmc/13) and conducted at the Department of Endocrinology and Metabolism, Services Institute of Medical Sciences, Lahore, Pakistan, after ethical approval from the institutional review board. We aimed to recruit 160 overweight and 80 normal-weight adults (of northern Punjabi ethnicity). To ensure sufficient representation of obese individuals with different degrees of insulin sensitivity, we invited members of the general public as well as obese individuals attending obesity awareness camps to participate in the study. A total of 255 healthy volunteers aged 18–45 years were enrolled in the study. The upper age cutoff was set to minimise the chances of including individuals with subclinical age-related diseases. Pregnant women and patients with infectious or immunologic diseases, evidence of liver or kidney disease, diabetes and other endocrinopathies, as well as patients who were on antibiotics or anti-inflammatory medicines, were excluded. The final study population consisted of 171 volunteers who were overweight or obese, but otherwise healthy, and 84 normal-weight controls. All participants gave informed consent to participate in the study, and all study-related procedures were carried out in accordance with the ethical guidelines in the Helsinki Declaration.
After clinical examination, 10 mL of fasting blood samples were obtained from eligible participants for biochemistry assays and enzyme-linked immunosorbent assays (ELISA). The presence of raised velvety skin on flexure surfaces was identified as acanthosis nigricans, which indicates hyperinsulinaemia. The perimeter of the affected skin at the nape of the neck was marked onto transparent paper. This particular site was chosen because of its ease of access. The marked area was later transferred onto graph paper to quantify the exact extent of acanthosis nigricans for association analysis.
Lifetime ASCVD risk was calculated using the Omnibus risk estimator(12) jointly developed by the American Heart Association and American College of Cardiology. All laboratory procedures were conducted at the Department of Pathology, Services Institute of Medical Sciences, Lahore. Haematological parameters, including total and differential leucocyte counts, cell volumes and indices, were determined on a KX-21N Hematology Analyzer (Sysmex Corporation, Kobe, Japan), while biochemical assays for glycated haemoglobin (HbA1c), blood glucose, lipid profile, liver enzymes, bilirubin, urea and creatinine were done on a Cobas c311 chemistry analyser (Roche Diagnostics Gmbh, Mannheim, Germany). ELISA for insulin, proinsulin, leptin, adiponectin, tumour necrosis factor-a (TNF-a), interferon-g, interleukin 2 (IL-2), interleukin 6 (IL-6), interleukin 10, C-reactive protein (CRP) and fibronectin were done using kits from IBL (Hamburg, Germany). Homeostatic model assessment of insulin resistance (HOMA-IR) was used as the surrogate marker of insulin resistance, and calculated by using a formula: (fasting plasma glucose [mmol/L] × fasting insulin [µIU/mL]) ÷ 22.5.
Statistical analysis was done using SPSS Statistics version 17.0 (SPSS Inc, Chicago, IL, USA). Quantitative variables were presented as mean ± standard error of the mean (SEM). Data from the subjects was stratified into tertiles based on BMI and HOMA-IR. One-way analysis of variance was used to compare the means of groups based on BMI tertile and HOMA-IR tertile, calculated separately. In the final analysis, obesity and insulin-resistance tertiles were cross-tabulated to identify subjects in whom obesity and insulin resistance were divergent. As the values of BMI represented a continuum, the middle BMI tertile in the obesity-insulin resistance cross-tabulation was excluded from the subsequent analysis to make the contrast between the extreme values clearer. A HOMA-IR cutoff value of 2.5 was used to stratify participants into insulin-sensitive or insulin-resistant categories, resulting in four groups: obese insulin-sensitive (OIS), obese insulin-resistant (OIR), lean insulin-sensitive (LIS) and lean insulin-resistant (LIR). In a second-tier analysis, the contrast was further refined by using an extreme group analysis, which excluded the middle tertile of both the BMI and HOMA-IR spectrum. The extreme groups were designated as LISe, LIRe, OISe and OIRe. Post-hoc comparison was done using Dunnett’s t-test and the OIR group was used as a control for comparison with all the other groups.
RESULTS
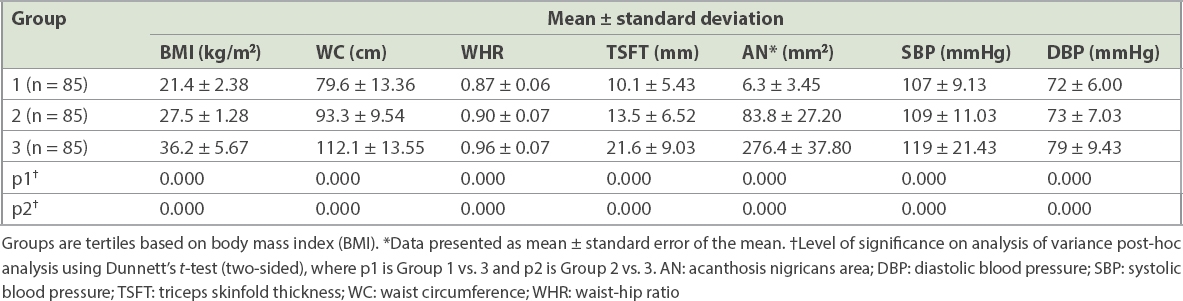
Out of 255 participants, 129 (50.59%) were male. Their mean age was 26.9 ± 6.7 years and mean BMI was 28.5 ± 7.1 kg/m2 (range 18–53 kg/m2). BMI tertiles were divided into Group 1 (< 25.29 kg/m2), Group 2 (25.30–30.46 kg/m2) and Group 3 (> 30.47 kg/m2). There was a progressive and statistically significant increase in waist-hip ratio (WHR), triceps skinfold thickness (TSFT), acanthosis nigricans area and systolic and diastolic blood pressure with each BMI tertile (
Table I
Anthropometric parameters of participants in different BMI tertiles (n = 255).
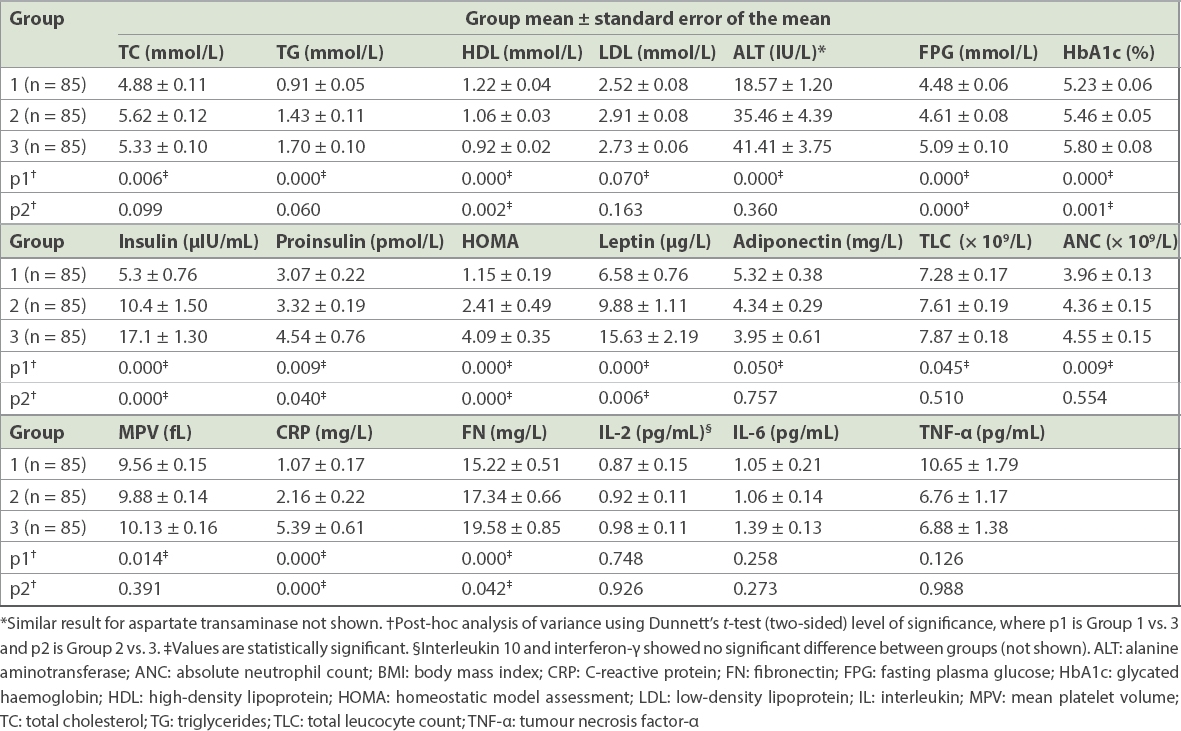
Fasting plasma glucose, HbA1c and HOMA-IR increased with each ascending tertile. A similar trend was seen for triglycerides, total cholesterol and low-density lipoprotein (LDL) cholesterol, while a decline was observed in high-density lipoprotein (HDL) cholesterol. Similarly, among haematological parameters, the total leucocyte count, absolute neutrophil count (ANC) and mean platelet volume (MPV) increased with increasing BMI, with a significant difference observed between the tertiles. A similar rising trend was seen for insulin, proinsulin and leptin, and a reverse trend for adiponectin. Among inflammatory markers, CRP and fibronectin increased significantly with higher BMI (
Table II
Biochemical, haematological, endocrine and immunological parameters in different BMI tertiles (n = 255).
Eight participants were excluded from the analysis due to unavailable HOMA-IR data. The remaining participants were divided into tertiles based on the degree of insulin resistance determined by HOMA-IR values. The HOMA tertiles were divided into Group 1 (< 0.899), Group 2 (0.900–2.449) and Group 3 (> 2.450). As with BMI tertiles, a clear trend was seen for anthropometric parameters including BMI, waist circumference, WHR, TSFT, acanthosis nigricans area, and systolic and diastolic blood pressure, all of which showed a significant rise with each increasing tertile of HOMA-IR (
Table III
Anthropometric parameters of participants in different HOMA tertiles (n = 247).
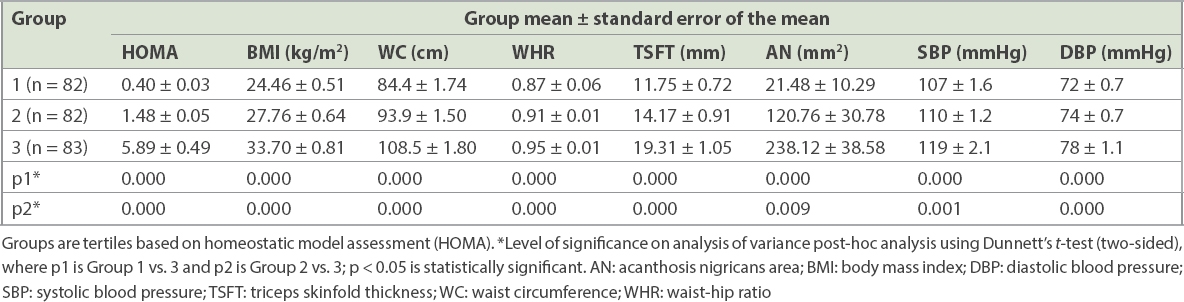
Table IV
Biochemical, endocrine and inflammatory parameters in participants in different HOMA tertiles (n = 247).
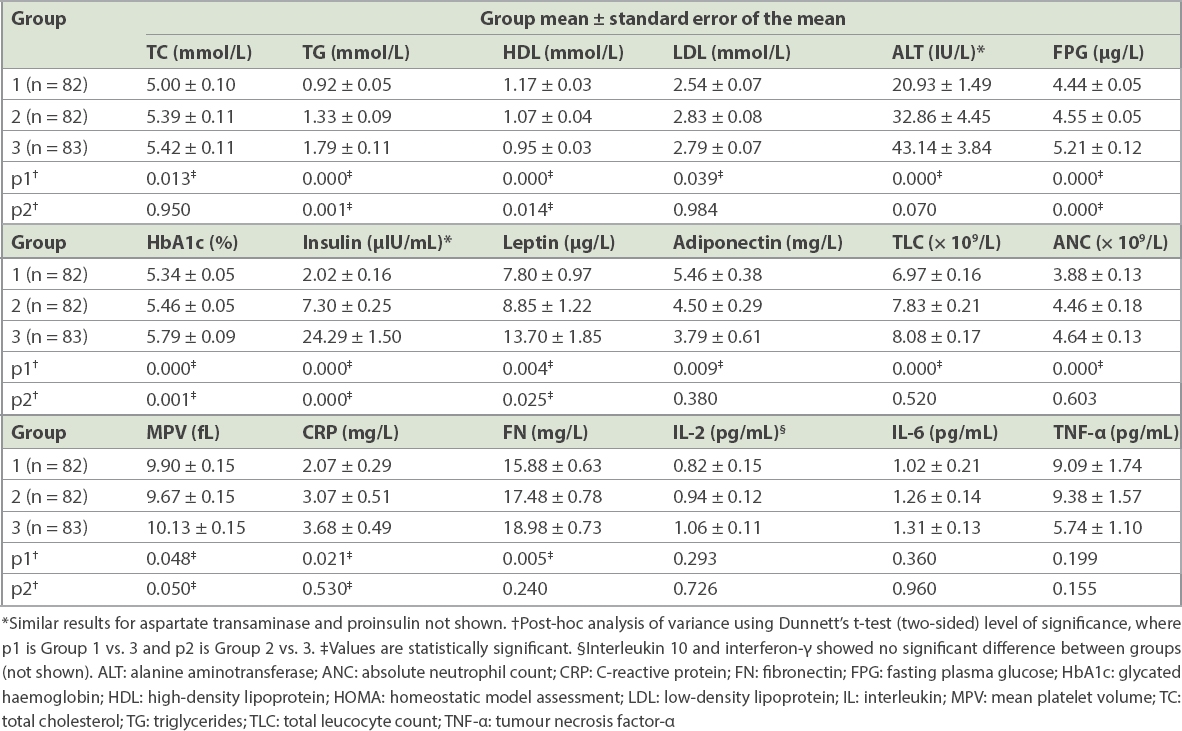
Haematological and immunological parameters were compared in the three groups based on insulin resistance tertiles to investigate the activation of pathways of inflammation. ANC and MPV among the haematological parameters, as well as CRP and fibronectin among the immunological parameters, showed significant increase across HOMA tertiles. Although IL-2 and IL-6 also showed an incremental trend with increasing insulin resistance, it was not statistically significant. A parallel rise could not be demonstrated for TNF-a or interferon-g (
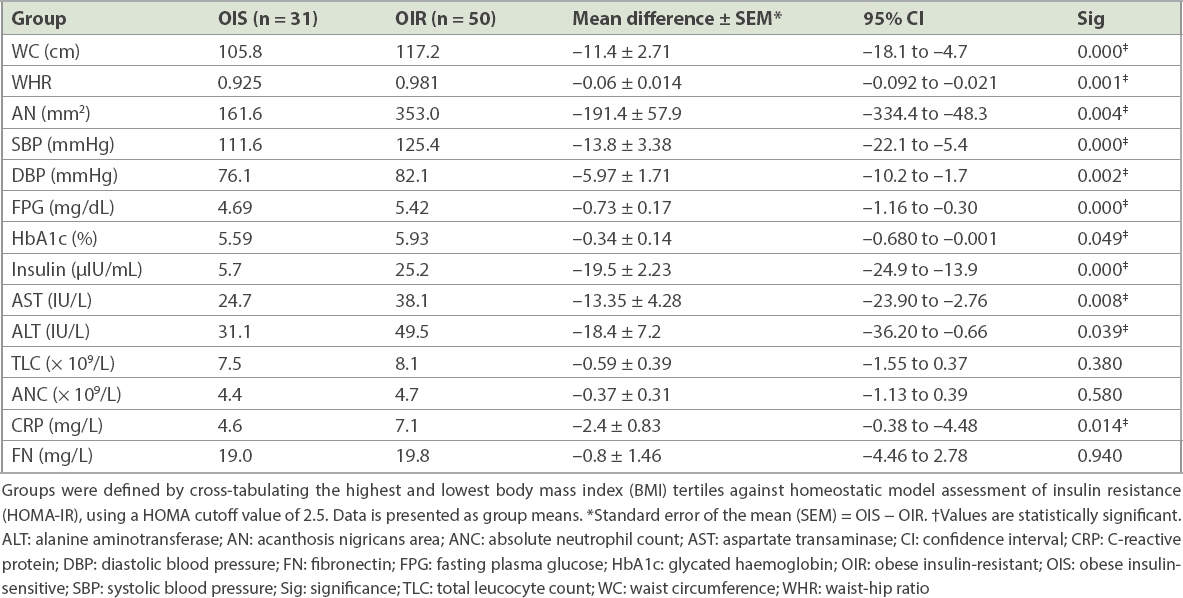
After the exclusion of 85 subjects in the middle BMI tertile, the results of 160 participants were cross-tabulated according to BMI and HOMA-IR. For this cross-tabulation, only those patients were included for whom a valid HOMA-IR result was available. Among the 160 participants, there were 81 participants in the highest BMI tertile; 50 (31.3%) were insulin resistant (i.e. OIR) and 31 (19.4%) were insulin sensitive (i.e. OIS) when a HOMA-IR cutoff value of 2.5 was used. Similarly, there were 79 participants in the lowest BMI tertile: 70 (43.8%) were insulin sensitive (i.e. LIS), while 9 (5.6%) were insulin resistant (i.e. LIR). The two lean groups and two obese groups were mutually comparable in terms of age and BMI (mean ± standard deviation [SD]) – LIS versus LIR: age 23.19 ± 3.37 years versus 22.56 ± 2.6 years and BMI 21.33 ± 2.5 kg/m2 versus 22.46 ± 2.2 kg/m2; OIS versus OIR: age 29.55 ± 6.38 years versus 32.02 ± 7.59 years and BMI 34.22 ± 4.75 kg/m2 versus 37.97 ± 5.87 kg/m2. When comparing anthropometric parameters and biochemical and inflammatory markers between OIS and OIR groups, a statistically significant difference was observed in waist circumference, WHR, blood pressure, acanthosis nigricans area, and fasting plasma glucose, HbA1c, hepatic enzymes, fasting insulin and CRP levels, while differences in other endocrine or inflammatory parameters failed to achieve statistical significance (
Table V
Cross-tabulation of BMI and HOMA using a HOMA-IR cutoff value of 2.5.
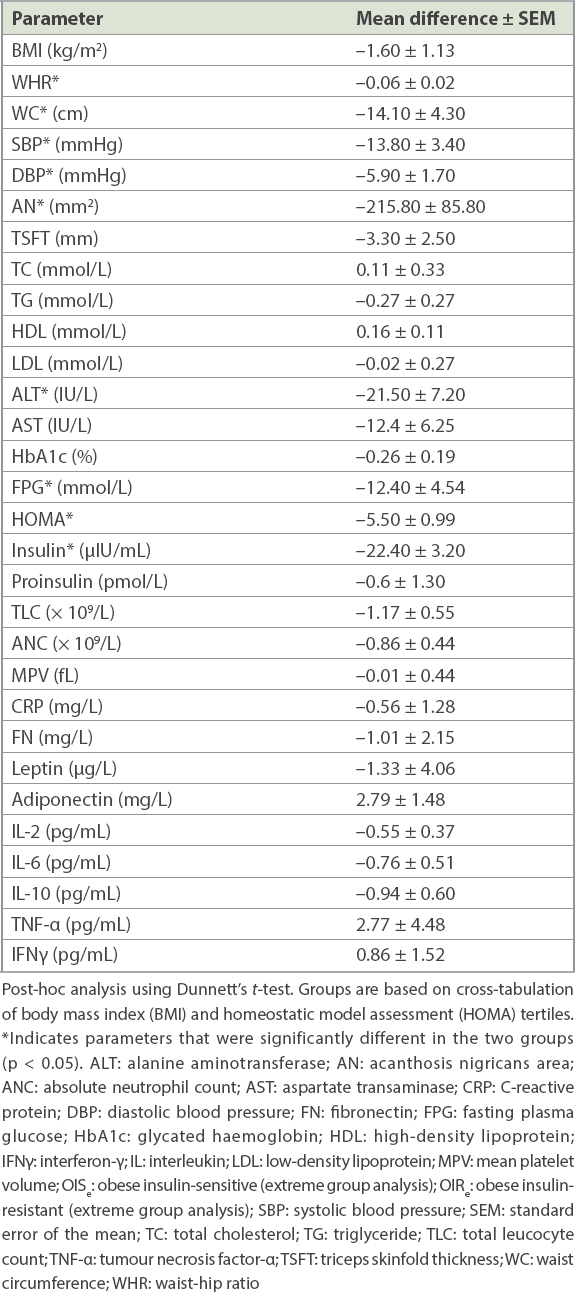
The final analysis was done using extreme group analysis, in which individuals with BMI and HOMA-IR values in the middle tertiles, expected to act as a grey zone of overlapping values, were eliminated to improve the contrast between subjects at extreme ranges of both the BMI and insulin resistance spectra. 128 patients were excluded as they fell into the middle tertile of either the BMI or HOMA-IR range, or both. Out of the 119 remaining participants, the number of participants in the four groups was: LISe 46 (38.7%); LIRe 9 (7.6%); OISe 11 (9.2%); and OIRe 53 (44.5%). The OISe and OIRe groups were compared using analysis of variance with two-sided Dunnett’s t-test post-hoc analysis. A significant difference was observed in waist circumference, WHR, acanthosis nigricans area, blood pressure, fasting plasma glucose and insulin levels, while observed differences in other biochemical, haematological and inflammatory parameters failed to reach statistical significance (
Table VI
Comparison of anthropometric and metabolic characteristics in the OISe (n = 11) and OIRe (n = 53) groups.
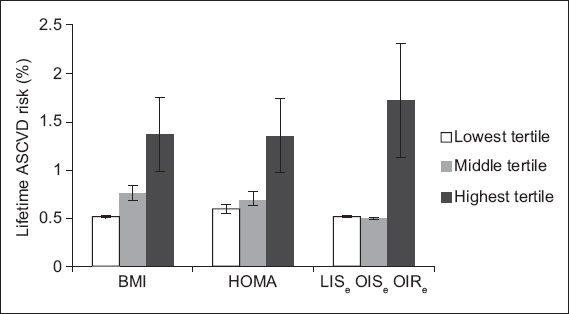
Lifetime ASCVD risk (expressed as a proportion of risk for a 50-year-old man with optimal risk profile, with SEM) was calculated using the American College of Cardiology-American Heart Association Omnibus risk calculator based on the 2013 Pooled Cohort Equations.(12) Lifetime ASCVD risk increased progressively across BMI- and HOMA-based tertiles: mean ASCVD lifetime risk proportions in ascending BMI tertiles were 0.513 ± 0.0089, 0.765 ± 0.0708 and 1.363 ± 0.3830 (p = 0.028); and mean ASCVD lifetime risk proportions in ascending HOMA tertiles were 0.591 ± 0.0474, 0.701 ± 0.0637 and 1.349 ± 0.3800 (p = 0.043). When lifetime ASCVD risk was calculated in the obese phenotype extreme groups, the risk for the OISe group was comparable to that for the LISe group and lower than that in the OIRe group (LISe 0.511 ± 0.0109, OISe 0.500 ± 0.0010, OIRe 1.717 ± 0.5980; LISe vs. OISe, p = 0.973; OISe vs. OIRe, p = 0.36;
Fig. 1
Bar graph shows the lifetime atherosclerotic cardiovascular disease (ASCVD) risk in different categories of subjects, which was calculated using the 2013 American College of Cardiology-American Heart Association Omnibus risk calculator(12) across groups based on (a) body mass index (BMI) tertiles, (b) homeostatic model assessment of insulin resistance (HOMA-IR) tertiles and (c) obesity phenotype. In extreme group analysis, the middle tertile of BMI and HOMA-IR was excluded from analysis to increase the contrast between the obese insulin-sensitive (OISe) and obese insulin-resistant (OIRe) groups. Lean insulin-sensitive (LISe) individuals were used as controls for this analysis.
DISCUSSION
While clinical observation and anecdotal data on the mismatch between obesity and metabolic risk profile has existed for a long time,(13) the concept was only formally proposed in 2001 by Sims.(14) In 2001, Brochu et al stratified obese, non-diabetic post-menopausal women on the basis of high or low insulin sensitivity and showed that the former group had a lower amount of visceral fat compared to the latter.(15) This finding was supported by evidence from clinical experience and epidemiological studies, wherein it was observed that there were many obese individuals who did not manifest the adverse phenotypic markers associated with increased cardiovascular mortality.(8) Over the years, studies have indicated the presence of a metabolically healthy obese phenotype in populations representing a variety of ages and ethnicities, among them adolescents,(16) the elderly,(17) Europeans,(18,19) Americans,(20) Africans,(21) Koreans,(22) Chinese(23) and Indians.(24)
This theory generated a great deal of popular interest, not only from the field of health economics (in which the existence of an obese state that does not require intervention, and that thus allows for selective targeting of obesity, had tremendous appeal), but also from patients, who found the idea of ‘healthy obesity’ irresistible.(25,26) This is the very reason physicians need to be cautious when embracing this concept, as a premature acceptance of the notion of a benign obese state may lead people to erroneously believe that obesity is not a detrimental condition, which may lead to dangerous repercussions.
Although the extensive interest in the stratification of obesity has generated a lot of research, there is considerable variation in the parameters and nomenclature used to define this potentially benign obese state. A variety of names, along with their accompanying acronyms, have been used to describe the condition, such as metabolically benign obesity (MBO),(8) metabolically healthy obesity,(27) insulin-sensitive obesity,(28) metabolically normal but obese,(29) and even the baffling metabolically non-obese obese.(24) The variety of methods used to stratify obesity in different studies raises the question: are all these studies referring to the same thing? Should obesity be stratified by insulin resistance,(30) fat distribution (visceral versus subcutaneous fat)(31) or cardiovascular risk factors?(7)
Regardless of which method is used to stratify obesity, the critical question is whether there is a difference in the prognosis for the defined groups. In other words, is there really a benign obese state?(32) Studies attempting to stratify obesity on the basis of cardiovascular risk factors have identified subgroups of obese people in whom these risk factors were absent and designated them as having MBO.(7) The problem with this approach is that while risk factors are surrogate markers, they do not measure actual outcomes. A recent retrospective outcome analysis of NHANES III data has cast doubt on whether a benign obese state truly exists, as there was increased all-cause mortality associated with obesity, irrespective of the presence or absence of an adverse metabolic profile.(29) Conclusive findings on the differences in risk between MBO and MUO can only come from long-term prospective outcome studies, but there are only a few studies in literature at present and most are still under way. Findings from the North West Adelaide Health Study indicate that obese individuals labelled as MBO on the basis of having fewer than two components of metabolic syndrome (according to the International Diabetes Federation’s definition) had a greater likelihood of developing incident diabetes compared to normal-weight individuals.(33) In the Dutch EPIC-MORGEN study, the distribution of body fat (whether abdominal or non-abdominal) was more significant in predicting mortality risk, compared to the putative state of metabolic health (a combination of normoglycaemia, normotension and normal lipid profile).(34) The prospective Pizarra study, which looked into outcomes of the presumptive MBO state, indicated that the ‘benign’ label for this state may in fact be misleading, as there is a clear adverse metabolic trend in these patients that would progress to Type 2 diabetes mellitus, just as in the case of MUO, albeit at a later stage.(35) Despite these unexpected early results from these prospective studies, it would be premature to conclude that the eventual outcome is comparable in all subgroups of obesity, before the results of the ongoing prospective studies become available.
Aside from the controversy surrounding the eventual outcome of MBO, the pathophysiology of this proposed benign obese state is yet another inconclusive area of contention. Researchers looking for differences in body composition,(27) visceral adipose tissue,(36) adipokine levels,(37) inflammatory markers(38) and populations of different inflammatory cells(39) between obesity subsets have reported variable results, which highlights the need for further work to elucidate the pathophysiology of obesity phenotypes. These controversies and gaps in knowledge were the impetus for the present study, particularly as there is a dearth of relevant data in the South Asian subcontinent.(40)
This study had three major objectives – first, to document the metabolic dichotomy among otherwise healthy South Asian obese individuals; next, to observe differences in known clinical and biochemical cardiovascular risk factors and estimated ASCVD risk in the groups that were defined; and finally, to find clues to the pathogenic mechanisms behind this metabolic variation in obesity. While obesity and insulin-resistance trends generally paralleled each other, we found variations in insulin sensitivity among both normal-weight and overweight/obese individuals, with 21% of obese individuals falling under the insulin-sensitive category. This percentage was comparable to one that was previously described in a European population.(8) As obesity lies on a continuum, we did not label our patients metabolically benign or unhealthy (i.e. MBO or MUO) as we felt this implied a divide that may not exist in reality. Instead, we cross-tabulated insulin resistance and BMI tertiles, excluding the middle thirds of each tertile from the analysis, and looked at the extreme ends of this spectrum to find how these patients differ from each other in terms of established cardiovascular risk factors as well as adipokine levels and circulating inflammatory markers. It was found that OIS and OIR individuals, as thus defined, constituted 4.3% and 20.0% of the overall study population, respectively, which was quite similar to the MBO prevalence observed in the Pizarra study.(35)
In the groups that were stratified based on insulin resistance and degree of obesity, we found that among the obese subgroups, there was a significant difference in both anthropometric and biochemical cardiovascular risk indicators, wherein the OIS group had a more favourable cardiovascular risk profile compared to the OIR group, although it had a tendency to be worse than that in LIS individuals. These findings concurred with the results reported by Wildman et al in epidemiological data from the NHANES study,(7) the findings by Bacha et al in overweight adolescents,(16) and the findings of Marini et al, who reported an intermediate cardiovascular risk profile for OIS Italian women.(18) We found that the seemingly benign metabolic profile of OIS individuals translated into an estimated lifetime risk of ASCVD that is similar to that of LIS individuals and lower than the estimates for OIR individuals. This was an interesting finding, especially in view of the intermediate biochemical profile noted earlier; it implied that the difference in blood pressure and lipids, which was dominant in influencing the ASCVD risk in this calculator, was related more to the status of insulin resistance, and thus resulted in marked ASCVD risk difference between the two obese groups and very little difference between the two insulin-sensitive groups.
In the mechanistic part of our study, we looked for differences in levels of adipokines and inflammatory markers. We found a clear trend of a worsening inflammatory profile and adipokine profile with increasing BMI and insulin resistance tertiles. However, in extreme group analysis, this difference in adipokine levels or markers of inflammation was no longer clearly visible in the demarcated OIRe or OISe groups. This was in contrast to the findings reported by Karelis et al, who were able to identify a difference in the inflammatory profile of MBO and MUO individuals.(38) While our findings do not necessarily negate the role of inflammation in the genesis of the OIR state, this lack of biochemical distinction may reflect the pathogenic similarity between the obese groups defined by insulin resistance, implying, as has been suggested in some early outcome studies, that there is no fundamental difference between obesity subgroups. The apparent distinction in risk is perhaps a matter of time, as the MBO patients eventually catch up with their unhealthy obese counterparts in terms of adverse outcomes.(36) On the other hand, the failure to observe a statistical difference in biochemical parameters in the obese subgroups may have been due to the extreme group methodology used in our study, which yielded relatively small numbers in the defined subsets, particularly the OIS phenotype, something future studies should take into account when determining their sample size.
Finally, the fact that we observed no clear association of systemic markers of inflammation with an adverse metabolic profile in obesity may be an indicator that the selection of humoral markers is not the best choice for observing such a relationship, as these are relatively short-term measures affected by day-to-day changes in inflammatory status and are less suited for assessing chronic tissue inflammation. We recommend that evidence of inflammation should be sought at tissue level, possibly by directly observing inflammatory cell infiltration.
In conclusion, we were able to identify a definite disparity in cardiovascular risk between OIS and OIR South Asian individuals, along with a correspondingly unfavourable metabolic profile in the latter. On the mechanistic side, although we were able to show a significant rise in adipokines and several markers of inflammation with increasing BMI and insulin resistance, we were unable to demonstrate clear differences in either the adipokine levels or inflammatory markers in the extreme groups that were defined by the presence or absence of a combination of obesity and insulin resistance. The fact that clinical parameters were consistently more reliable indicators of metabolic risk compared to laboratory parameters highlights the importance of anthropometric examination as a low-cost, but effective, approach for assigning cardiovascular risk in obesity.
ACKNOWLEDGEMENTS
The authors wish to express their gratitude to Prof Ghazala Jaffery for her gracious permission to use the facilities of the Pathology Department, Services Institute of Medical Sciences, for experimental work, and Muhammad Aslam for technical assistance. The help of Dr Amna Haider and Dr Rizwan Niazi in data collection and Talha Irfan Khawaja in editing is gratefully acknowledged. The research was funded by a research grant from SIMS, Lahore, Pakistan.