

Abstract
INTRODUCTION
We aimed to investigate changes in renal cortical stiffness (CS) in Type 2 diabetes mellitus (DM) and pre-DM patients compared to subjects with normal glucose metabolism (NGM), as well as the usefulness of renal CS to determine the presence of nephropathy.
METHODS
This study included 125 individuals with NGM, pre-DM and Type 2 DM. Routine laboratory data was obtained, and micro- and macrovascular involvement were investigated. Urinary albumin-creatinine ratio (UACR) was measured for urinary albuminuria detection. In addition to routine renal ultrasonography, CS was measured using renal elastography.
RESULTS
Among the included patients, 42, 40 and 43 patients had NGM, pre-DM and Type 2 DM, respectively, with prevalence of nephropathy of 5%, 15% and 33%, respectively. Carotid and aortic intima-media thickness (IMT), renal width, and CS were found to be higher in the pre-DM and Type 2 DM groups than the NGM group. Aortic IMT, renal width and UACR levels were independently associated with CS. Patients with nephropathy were found to have a higher CS value than those without nephropathy (8.72 ± 1.67 kPa vs. 10.60 ± 1.74 kPa, p = 0.001). In receiver operating characteristic curve analysis, when the cut-off value for CS was taken as 9.2 kPa, renal CS predicted the possibility of nephropathy with 78.9% sensitivity and 71.4% specificity.
CONCLUSION
CS values are significantly higher in patients with impaired glucose metabolism. We recommend CS measurement as part of routine screening of nephropathy in patients with pre-DM and newly diagnosed Type 2 DM.
INTRODUCTION
Diabetes mellitus (DM) is a chronic, progressive disease that causes long-term microvascular and macrovascular complications in many organs, including the eye, kidney, heart and peripheral nerves. Organ involvement is the most common cause of increased DM-related mortality and morbidity. Impaired fasting glucose and impaired glucose tolerance are two known prediabetic glucose metabolic disorders associated with microvascular and macrovascular complications.(1-11) Epidemiologic studies have reported a 14% prevalence of pre-DM in populations over the age of 45,(12,13) suggesting that the lifelong risk of developing DM in these individuals may be 48%–74%.(12,13) The prevalence of pre-DM and DM is estimated to be 592 million and 471 million people in 2035, respectively.(14) Thus, precautions taken for early diagnosis and treatment of both clinical conditions may prevent or delay the development of microvascular and macrovascular complications.
Pre-DM and newly diagnosed Type 2 DM patients have a significant presence of kidney disease, suggesting that they may develop nephropathy before DM develops.(15-17) The Rotterdam study(13) and Melsom et al(12) reported that early treatment of pre-DM patients could prevent the onset of diabetic kidney disease (DKD). For this reason, it is important to diagnose this disease early in the course of pre-DM and before the development of nephropathy. Urinary albumin-creatinine ratio (UACR) can be used to detect early development of nephropathy, but there is still no objective parameter predicting the development of nephropathy.(12,18) Studies have shown that changes at the cellular level occur before the diagnosis of nephropathy-related abnormalities.(19)
Shear wave elastography (SWE) has recently become a commonly used technique and has begun to be used in patients with DM. It has been shown that patients with Type 2 DM have an increase in renal cortical stiffness (CS) that is observed on SWE.(20-22) However, to our knowledge, there is no information in the literature regarding changes in CS in patients with pre-DM and newly diagnosed Type 2 DM. We hypothesise that CS, as determined by SWE, may indicate early changes at the cellular level prior to the onset of nephropathy in patients with pre-DM and newly diagnosed Type 2 DM. In this study, we aimed to investigate changes in renal CS in pre-DM and newly diagnosed Type 2 DM patients compared to subjects with normal glucose metabolism (NGM) and to investigate the usefulness of renal CS in determining the presence of nephropathy in these diseases.
METHODS
This cross-sectional study included 125 individuals who had three different glucose metabolic states but were not different in terms of age and gender. They were categorised as Group I: subjects with NGM (age 57.4 ± 6.9 years; 22 female, 20 male); Group II: patients with pre-DM (age 58.3 ± 6.9 years; 28 female, 12 male); and Group III: patients with newly diagnosed Type 2 DM (age 59.5 ± 8.5 years; 24 female, 19 male). Excluded patients had active urinary tract infection, hydronephrosis, kidney stones, renal tumour, polycystic kidney disease, priorly known Type 1 and Type 2 DM, known renal disease, severe heart valve disease, alcohol addiction, abdominal aortic aneurysm and dissection, inflammatory diseases, active thyroid disease, chronic liver disease, cancer, and/or pregnancy. The study was conducted according to the recommendations of the Declaration of Helsinki on biomedical research involving human subjects, and the protocol was approved by the institutional ethics committee. All forms of voluntary consent for all patients were explained in detail and patients were included in the study after receiving written approval.
Detailed anamnesis and physical examinations were performed for the included patients. Subsequently, baseline demographic characteristics of all groups were obtained for age, gender, hypertension, presence of hyperlipidaemia, smoking, coronary artery disease (CAD), peripheral arterial disease (PAD) and stroke history. Pulse rate, systolic blood pressure (SBP) and diastolic blood pressure (DBP) were recorded. Body mass index was calculated by measuring weight and height.
Patients were grouped according to 2016 American Diabetes Association guidelines.(23) Those who had previously been referred to the DM polyclinic based on laboratory results showing unknown glucose metabolism status and who were undiagnosed with pre-DM or DM were divided into three groups according to their glucose metabolism status. These were: (a) accepted as Type 2 DM with glycated haemoglobin (HbA1c) levels ≥ 6.5%, fasting plasma glucose levels ≥ 126 mg/dL and second-hour plasma glucose levels 75 g oral glucose tolerance test (OGTT) ≥ 200 mg/dL; (b) accepted as pre-DM with HbA1c levels 5.7%–6.5%, fasting plasma glucose levels ≥ 100 mg/dL and < 126 mg/dL (impaired fasting glucose), and second-hour plasma glucose levels 75 g OGTT ≥ 140 mg/dL and < 200 mg/dL (impaired glucose tolerance); (c) accepted as NGM with HbA1c levels < 5.7%, fasting plasma glucose levels < 100 mg/dL and second-hour plasma glucose levels 75 g OGTT < 140 mg/dL.
Blood samples were taken from an antecubital vein after patients rested for 20 minutes in the supine position. Blood samples were collected in tubes containing ethylenediaminetetraacetic acid. The samples were spun at 3,000 rpm for ten minutes at 0°C. Fasting blood glucose, blood urea nitrogen, creatinine, total cholesterol, high-density lipoprotein cholesterol, low-density lipoprotein cholesterol and triglyceride levels at the time of admission were measured with the standard automated laboratory method (Abbott Aeroset; Abbott Diagnostics, MN, USA) using appropriate commercial kits (Abbott Aeroset; Abbott Diagnostics, MN, USA). The estimated glomerular filtration rate (eGFR) was calculated using the Modification of Diet in Renal Disease Study Group’s formula as follows: eGFR (mL/min/1.73 m2) = 186 × (serum creatinine) − 1.154 × (age) − 0.203 (or 0.742 for female patients).(24)
HbA1c measurement was made with an automated chemistry analyser (Abbott Aeroset; Abbott Diagnostics) using appropriate commercial kits (Abbott Aeroset; Abbott Diagnostics). Serum aspartate aminotransferase, alanine aminotransferase, high-sensitivity C-reactive protein, N-terminal pro b-type natriuretic peptide (NT-proBNP) and uric acid levels were measured with an automated chemistry analyser (Abbott Aeroset; Abbott Diagnostics) using appropriate commercial kits (Abbott Aeroset; Abbott Diagnostics). Morning urine was used to determine standard albuminuria levels. Albuminuria was determined by calculating the UACR in laboratory results.
Guideline recommendations were used to identify microvascular and macrovascular complications related to Type 2 DM.(23,25-27) Macrovascular complications consisted of the cardiovascular diseases CAD, PAD and stroke. Microvascular complications consisted of nephropathy, retinopathy and neuropathy. The Kidney Disease: Improving Global Outcomes (KDIGO) criterion was used to determine the patient’s nephropathy or stage of DKD; DKD was classified into five stages on the basis of eGFR using KDIGO criteria, with eGFR as follows: Stage G1 ≥ 90 mL/min/m2, Stage G2 60–89 mL/min/m2, Stage G3 30–59 mL/min/m2, Stage G4 15–29 mL/min/m2, Stage G5 ≤ 15 mL/min/m2. For Stages G1 and G2 (eGFR ≥ 60 mL/min/m2), the presence of markers of kidney damage (UACR ≥ 30 mg/g) is necessary to diagnose DKD.(25) Neuropathy was confirmed by detailed history and evaluation of temperature and vibration sensation.(26) Retinopathy was detected through a comprehensive eye examination.(27)
All patients underwent vascular and renal ultrasonography (US) screening using a high-resolution US device (Philips EPIQ 7; Philips Healthcare, Bothell, WA, USA) with a 12 MHz linear and 1–5 MHz high resolution convex probe (Philips Healthcare, Bothell, WA, USA). US examinations were performed after a minimum of six hours of fasting and 20 minutes of rest. The common carotid artery intima-media thickness (IMT) and abdominal aortic IMT were calculated as previously described.(28) Grey-scale B-mode US evaluation was first performed to assess kidney sizes, cortical thickness and parenchyma echogenicity. Kidney length was measured in the coronal plane from the upper pole to the lower pole of the kidney. Renal width was measured from the middle pole and recorded as the distance between the renal hilum and renal capsule. Cortical thickness was recorded as the distance from the medial section of the renal medullary pyramid base to the renal capsule.
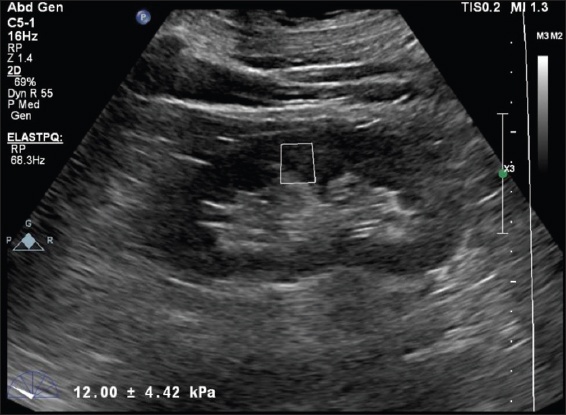
SWE evaluation was performed using a 1–5 MHz convex abdominal probe, the ElastPQ software system and acoustic radiation force impulse technique. All measurements were performed as previously described.(7) For renal US, patients were examined in the left and right lateral decubitus position. The probe was compressed as lightly as possible and placed in a stable position, and the patient was asked not to breathe for a few seconds to minimise the movement of the kidney due to respiration. Measurements were obtained on renal US by placing the region of interest (ROI) on the target (
Fig. 1
US image shows cortical stiffness measurement using shear wave elastography in a patient with prediabetes mellitus. Increased shear wave velocity of 12.00 ± 4.42 kPa is observed.
All analyses were performed with IBM SPSS Statistics version 20.0 (IBM Corp, Armonk, NY, USA). Variables were divided into categorical and continuous variables. The normal distribution of continuous variables was assessed using the Kolmogorov-Smirnov test. Continuous variables in the group were expressed as mean ± standard deviation. Categorical variables were presented in numbers and percentages. Continuous variables that showed normal distribution were compared using analysis of variance, whereas the Kruskal-Wallis test was used for non-normally distributed samples. Chi-square test was used to compare categorical variables. Univariate correlation analysis of the parameters associated with renal CS was performed using Pearson’s and Spearman’s correlation method. Statistically significant parameters were included in the linear regression analysis and the parameters most closely related to renal CS were determined. Receiver operating characteristic curve analysis was performed to determine the patients with nephropathy. Parameters with area under the curve > 0.650 were determined. From these parameters, limit value determination was done to determine the best sensitivity and specificity in the determination of nephropathy. A p-value < 0.05 was considered statistically significant.
RESULTS
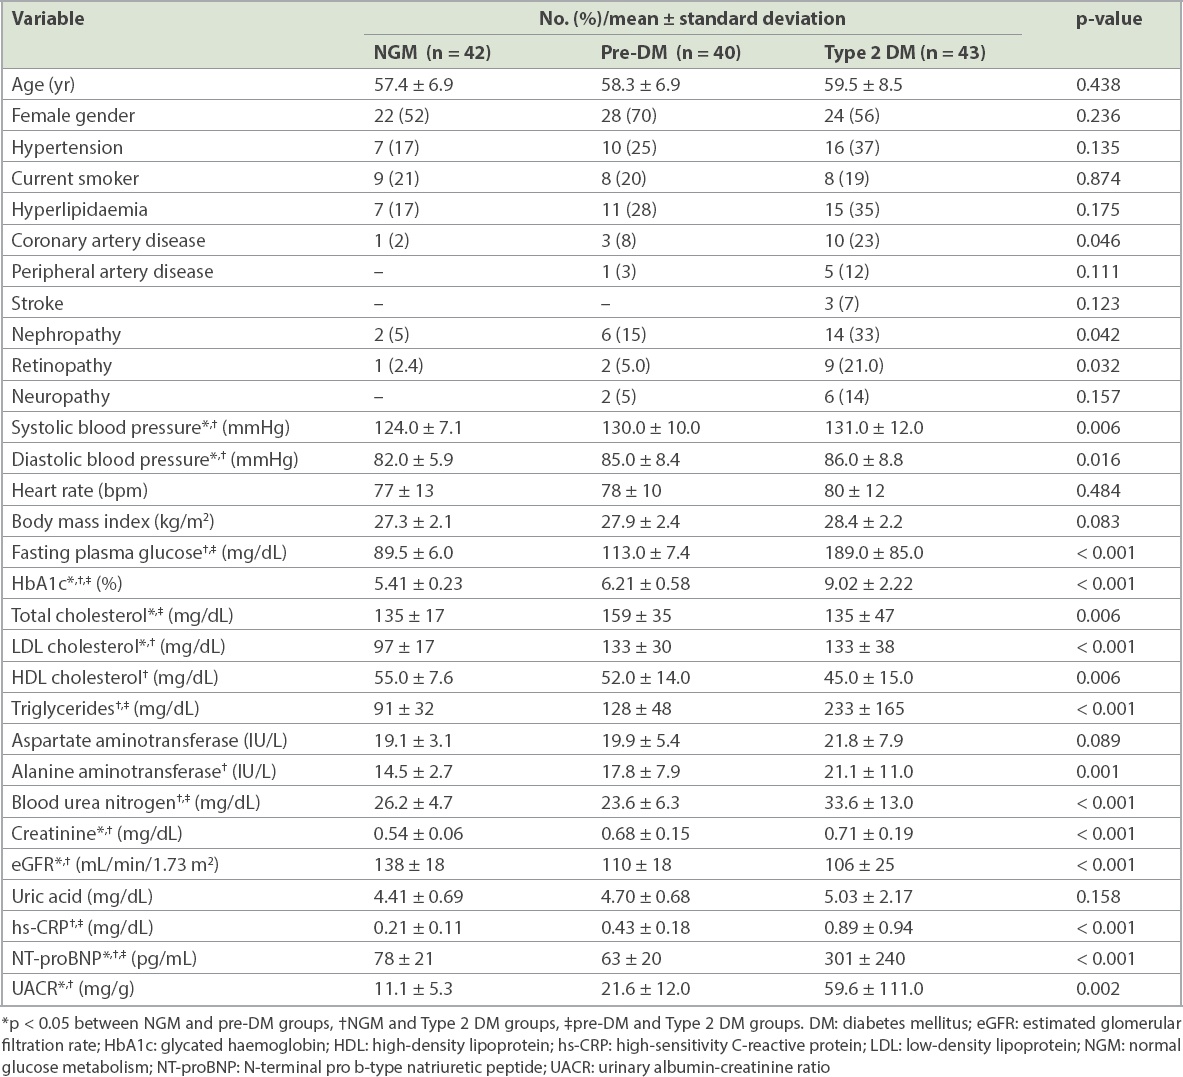
The study data was compared by dividing the patients into NGM, pre-DM and Type 2 DM groups according to their glucose metabolism status. All clinical and demographic findings were similar among the groups except for nephropathy frequency, retinopathy frequency, SBP and DBP (
Table I
Clinical, demographic and laboratory findings of the study groups according to glucose metabolism status.
When the study groups were compared, it was found that all US findings were similar in the pre-DM and Type 2 DM patients. Carotid and aortic IMT, kidney length, and CS values were found to be higher in the pre-DM and Type 2 DM groups than the NGM group (
Table II
Vascular and renal ultrasonography findings of the study groups according to glucose metabolism status.
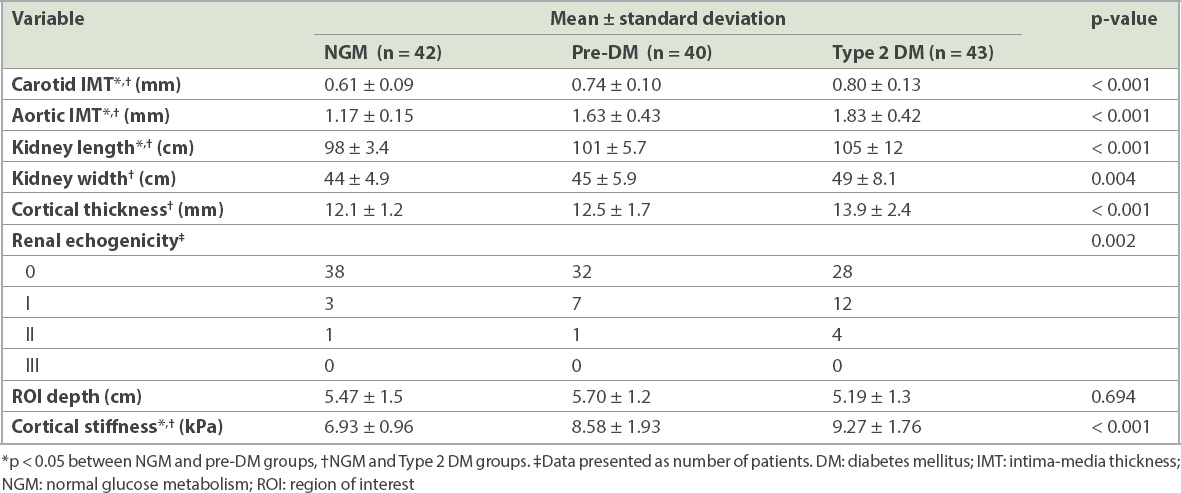
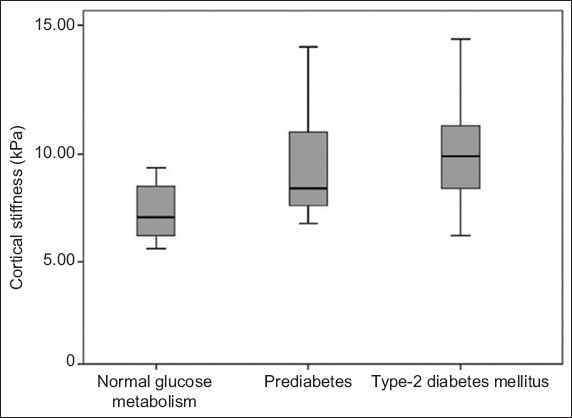
Fig. 2
Box plot shows renal cortical stiffness values according to the glucose metabolism status of the study groups.
The demographic, clinical, laboratory and US parameters associated with CS in the univariate analysis are summarised in
Table III
Parameters associated with renal cortical stiffness and linear regression analysis for parameters significantly correlated with renal cortical stiffness.
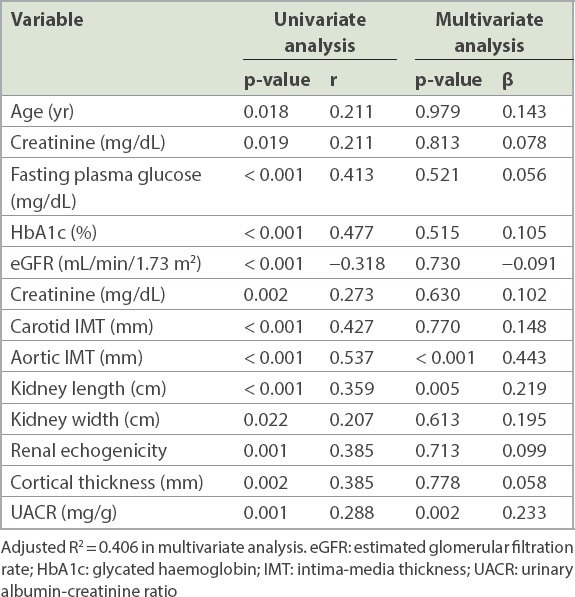
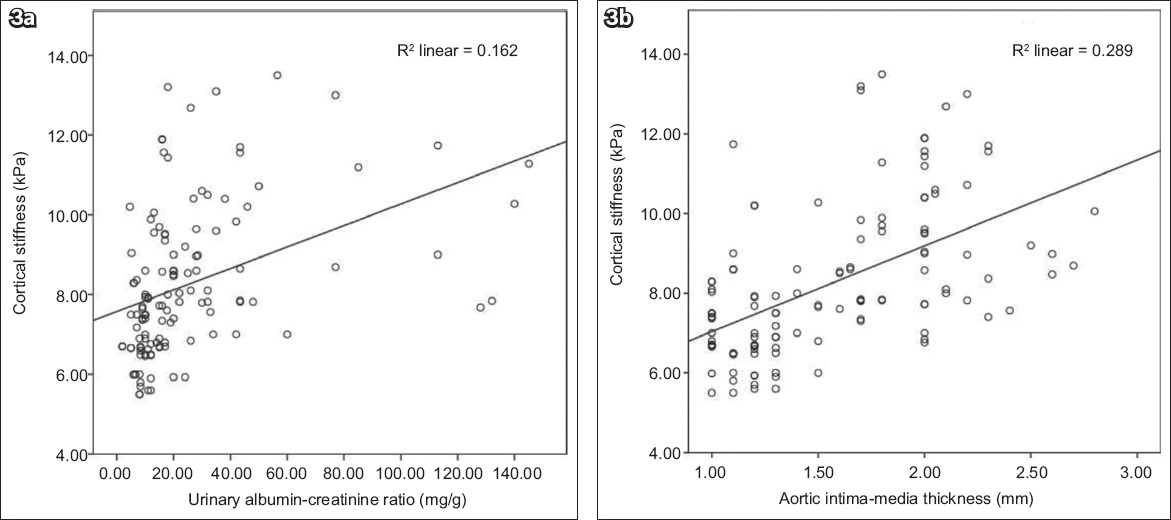
Fig. 3
Scatter plots show a significant correlation between (a) renal cortical thickness and urinary albumin-creatinine ratio; and (b) renal cortical thickness and aortic intima-media thickness.
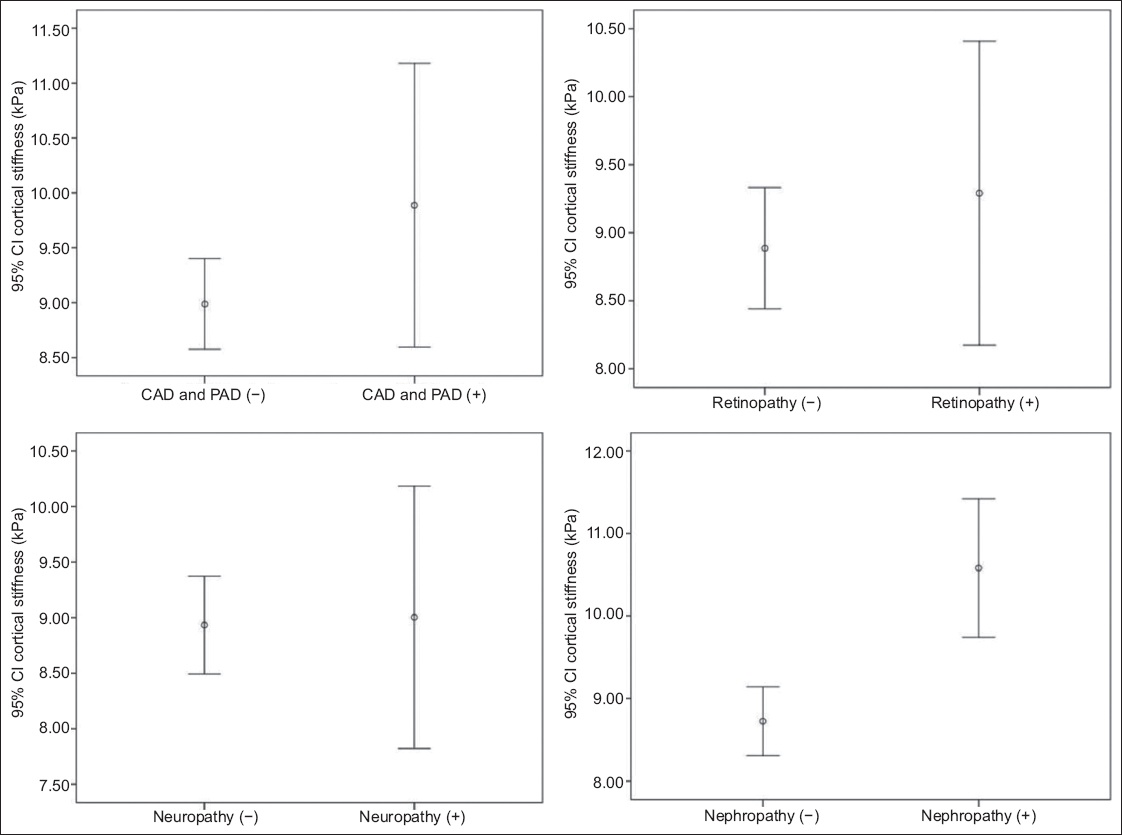
Data on the microvascular and macrovascular organ involvement of the patients with pre-DM and Type 2 DM is shown in
Fig. 4
Box plots show renal cortical stiffness values in patients with microvascular and macrovascular complications. CAD: coronary artery disease; CI: confidence interval; PAD: peripheral artery disease
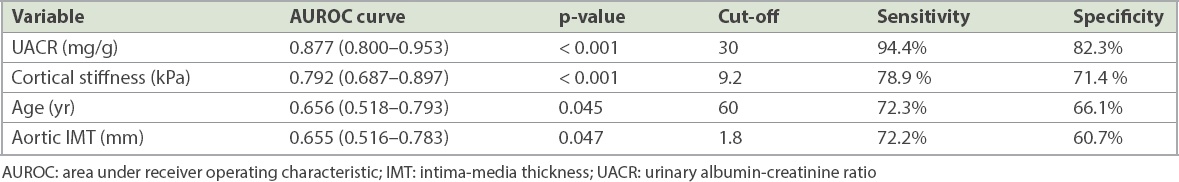
Receiver operating characteristic curve analysis was performed to determine the parameters that best predict the development of nephropathy based on clinical, demographic, laboratory and US data that was different from that in patients with nephropathy (
Table IV
Receiver operating characteristic curve analysis for predicting the presence of nephropathy.
DISCUSSION
The main finding of this study was that renal CS is significantly higher in subjects with Type 2 DM and pre-DM than in those with NGM. Another important finding was the close and independent relationship between renal CS and UACR. We also found increased complications of nephropathy and retinopathy in patients with pre-DM, which was consistent with previous data, as well as in Type 2 DM patients.
In patients with pre-DM, both impaired glucose tolerance and impaired fasting glucose are associated with a cardiovascular event.(1) Undiagnosed myocardial infarction is more prevalent in patients with pre-DM than in those with NGM (3.5% vs. 1.4%).(9) Furthermore, a meta-analysis of 17 trials showed increased CAD, PAD and stroke frequency.(1,10,11) In our study, 10% of patients with pre-DM had macrovascular complications.
The development of retinopathy in Type 2 DM is well known: there is a risk of retinopathy in the pre-DM stage, when it is more common than in NGM patients with a prevalence of about 8%.(2,4) Retinopathy prevalence was reported to be 6.7% and 8.2% in the other two studies.(3,4) In our study, the prevalence of retinopathy in NGM, pre-DM and Type 2 DM patients was significantly different at 2.4%, 5.0% and 21.0%, respectively. While there is no clear data on neuropathy in those with pre-DM, it has been reported that in a study of prediabetic patients, the frequency of autonomic neuropathy was 8%–9.8%.(8) In our study, there was no neuropathy in those with NGM, but DM patients had an increased frequency of neuropathy compared to those with pre-DM; however, the difference was not statistically significant (14% vs. 5%, p = 0.157). 20%–30% of patients with Type 2 DM develop nephropathy in the long term, while the most important problem in DM patients is DKD.(19) Individuals diagnosed with pre-DM have a higher incidence of nephropathy than those with NGM and the most common form of microvascular organ involvement among them is nephropathy.(1) The National Health and Nutrition Examination Survey’s data analysis found that the prevalence of chronic renal disease was 11.8%, 17.1% and 24.2% in non-DM, pre-DM and newly diagnosed DM patients, respectively.(5) In our study, the prevalence of nephropathy in NGM, pre-DM and DM patients was 5%, 15.0% and 33.0%, respectively.
In a study conducted on a large group of patients in Korea, patients in the pre-DM stage had more proteinuria than normal individuals (6.6% vs. 3.6%).(7) A study conducted by Metcalf et al(6) once reported that nephropathy associated with microalbuminuria was more prevalent in the stage of pre-DM than in NGM (16.1% vs. 4%). This rate of nephropathy is very close to that of our study. Different parameters have been used for detecting the development of nephropathy, with the most commonly used test investigating the presence of albuminuria in spot or 24-hour urine. In our study, a KDIGO criterion that includes albuminuria was used for detection of nephropathy.(25) Previous studies have reported that albuminuria is significantly higher in patients with pre-DM than in those with NGM.(29-32)
DM is known to cause progressive renal disease with glomerular hyperfiltration. A study conducted by Melsom et al(12) in patients with pre-DM and another study performed with patients in the early stages of DM showed that hyperglycaemia and glomerular hyperfiltration were associated with albuminuria development.(18) The albuminuria mechanism that occurs in the pre-DM stage can be explained by the presence of glycation and thickening in glomerular basal membrane proteins caused by hyperglycaemia, increase in intraglomerular pressure, the loss of selective permeability of the glomerular membrane, glomerular hyperperfusion and hyperfiltration.(33) Our study also found that UACR-detected albuminuria was significantly higher in both the DM and pre-DM groups than in those with NGM. In addition, there was a close and independent relationship between UACR and renal CS. This association is thought to be due to the physiopathologic changes causing albuminuria in the early phase of impaired glucose metabolism and can be shown objectively through renal elastography. With early detection of increased CS, albuminuria or DKD progression in pre-DM or early DM can be reduced or prevented with diet, exercise and, if necessary, medical treatment.
Conventional renal US is another examination to detect the presence of nephropathy or differential diagnosis in DM or prediabetic patients. Due to the hyperfiltration of DM and pre-DM, morphological changes such as increased echogenicity and increased renal size may be seen on conventional US, but it does not provide specific information for the detection of nephropathy in newly diagnosed Type 2 DM and prediabetic cases. CS values obtained in SWE tests have been more popular recently.(21) SWE is a cost-effective, reliable and noninvasive US test that can be used to determine tissue elasticity.(34) Renal parenchymal fibrosis is the most important sign of kidney disease, causing changes in mechanical features of kidneys that can be measured objectively with SWE.(21) Increases in renal CS, as determined by SWE, are known to occur in patients with Type 2 DM.(18,20,21) However, to our knowledge, there is no information regarding CS changes in patients with pre-DM in the literature. Studies revealed that changes at the cellular level occur prior to the diagnosis of abnormalities associated with nephropathy.(19) The limitations of SWE are its inconsistent availability in clinics and the absence of standardised normal values of CS for DM and prediabetic patients.
In the present study, a 9.2 kPa cut-off value for CS could determine the possibility of nephropathy with 78.9% sensitivity and 71.4% specificity. However, our data was not comparable with that of other studies because their patients with pre-DM or newly diagnosed Type 2 DM had no prior CS studies with renal elastography. Development of DKD is still observed in DM patients and is the main risk factor for cardiovascular diseases. For this reason, it is important to diagnose DM patients in stages of pre-DM and to diagnose pre-DM before the presence of microvascular organ involvement. Renal CS is higher in those with impaired glucose metabolism than with NGM. In the subgroup analysis, CS increased in DM patients compared to the patients with pre-DM, but the difference was not statistically significant, suggesting that the increase in renal CS occurred during the early stage of impaired glucose metabolism. Our study also showed a significant association between renal CS and UACR, which is the first time this relationship has been shown, to the best of our knowledge. This finding should be confirmed with further studies involving many more patients, because renal CS is an objective, stable parameter and can be used in the early detection of microvascular complications, preferably before the onset of newly acquired albuminuria.
The present study had some important limitations. First, the sample size was relatively small and the study was conducted in a single centre. A follow-up multicentre study with more patients is required. Second, our study was cross-sectional and patients with newly diagnosed Type 2 DM were included, but data on the disease duration since first diagnosis was not available, and thus we could not find out whether DM duration affected the results. Third, some patients were excluded from the study due to the technical limitations of our equipment. For example, we had to exclude patients with renal cortical parenchymal thickness < 1 cm and those with deeply located kidneys (> 8 cm from the skin surface) because the ROI target distance of our US equipment was a maximum of 8 cm and the ROI constant box size was 0.5–1 cm.
In conclusion, renal CS values in patients with newly diagnosed Type 2 DM and pre-DM were significantly higher than that in those with NGM, and were closely related to nephropathy development. There was also a very close relationship between renal CS and UACR. Our study findings suggest that increased CS as seen on renal elastography may predate or predetermine the development of nephropathy, which is, in turn, the most frequent microvascular complication in patients with impaired glucose metabolism. Hence, we conclude that routine measurement of renal CS with renal elastography in patients with pre-DM and DM may be useful to identify patients at risk for DKD even before microvascular complications are fully manifested in these patients. It is important to diagnose DM patients in pre-DM stages and to diagnose pre-DM before the presence of microvascular organ involvement. For this purpose, besides the periodic use of microalbuminuria, subsequent measurements of CS using renal elastography may be important and can be used periodically at patient follow-up.