

Abstract
A patient with non-ischaemic cardiomyopathy, and pre-existing atypical atrial flutter and left bundle branch block, developed broad complex tachycardia. In this unique and uncommon case of double tachycardia, we discuss the diagnostic approach of ventricular tachycardia in patients with broad complex tachycardia, and the use of different contemporary algorithms to help diagnose ventricular tachycardia and differentiate it from supraventricular tachycardia with aberrant conduction.
INTRODUCTION
Accurate electrocardiographic diagnosis of broad complex tachycardia is important for both treatment during acute presentation and long-term treatment, and prognostication. Over the years, various algorithms have been proposed to help differentiate ventricular tachycardia (VT) and supraventricular tachycardia (SVT) with aberrant conduction. Although individual algorithms are not perfect and risk oversimplifying the clinical condition, it is important that every physician has an initial strategy when approaching a case of broad complex tachycardia. We herein report the case of a patient with non-ischaemic cardiomyopathy, and pre-existing atypical atrial flutter and left bundle branch block (LBBB), who developed broad complex tachycardia. We also discuss the diagnostic approach of VT in such patients.
CASE REPORT
A 58-year-old man presented with shortness of breath and broad complex tachycardia. He had a significant history of diabetes mellitus, hypertension, hyperlipidaemia, atrial flutter and non-ischaemic cardiomyopathy, with an ejection fraction of 22%. He had previously refused implantation of a cardioverter defibrillator.
A 12-lead electrocardiography (ECG) performed during tachycardia demonstrated regular broad complex tachycardia with flutter waves marching across the screen, a QRS complex duration of 172 ms, and a right bundle branch block (RBBB)-like morphology of 167 beats/min (
Fig. 1
12-lead ECG shows regular broad complex tachycardia of atypical right bundle branch block morphology, with underlying atypical atrial flutter waves (arrows) and no fixed relationship to QRS complexes.
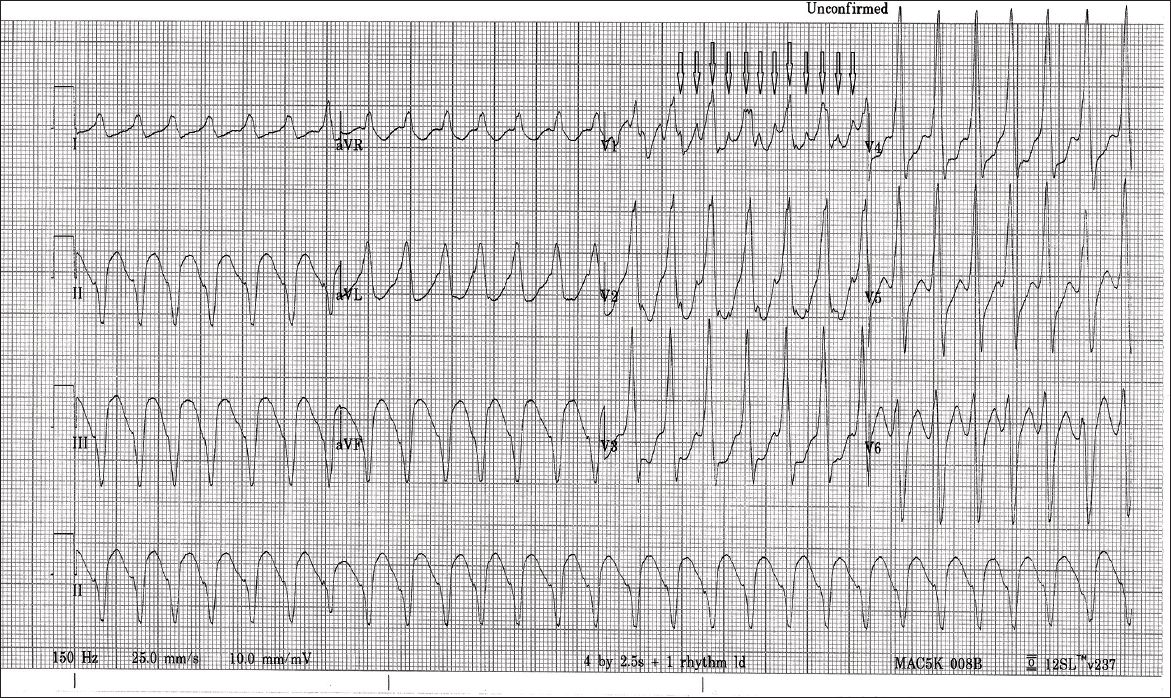
Fig. 2
Baseline 12-lead ECG shows irregularly irregular RR intervals with typical left bundle branch block morphology and atypical flutter waves (arrows) with no fixed relationship to QRS complexes.
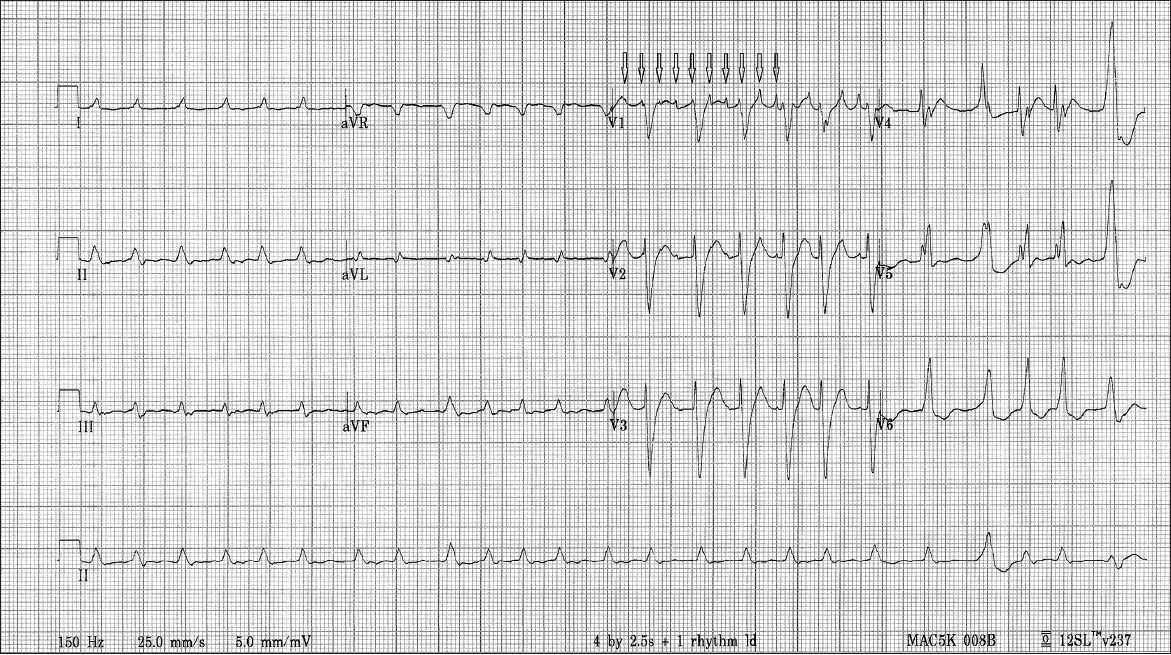
Intermittently, atypical atrial flutter waves with pointed appearances at cycle lengths of 160 ms were seen indenting the diastolic intervals between the regular RR intervals in V1 (
DISCUSSION
Despite the presence of a wide variety of algorithms for differentiating broad complex tachycardia, the ability to make a rapid and accurate diagnosis of the condition remains a clinical challenge. Previously, Isenhour et al(1) and Lau et al(2) separately demonstrated that real-life application of the Brugada algorithm did not achieve sensitivity and specificity values as high as that reported by the authors of the algorithm.(3) Miller et al recently re-evaluated some of the ECG differentiating criteria and found no statistical difference in using this criteria or the criteria of negative concordance to differentiate between patients with VT and those with SVT.(4) It has been postulated that since patients with heart failure live longer, they may be more prone to experience atrial fibrillation.(5) The use of classes IA and IC antiarrhythmic agents for the rhythm control of paroxysmal episodes may account for progressive widening of the QRS complex.(6) When SVT occurs in patients who are using these antiarrythmic agents, the rhythm may be conducted with a bizarre pattern that is similar to the baseline ECG, but may be erroneously labelled as VT in the absence of a baseline ECG for comparison.
A more robust criteria that has been tested in recent times is the aVR criteria developed by Vereckei et al (
Fig. 3
The aVR criteria(7) used for the diagnosis of ventricular tachycardia. SVT: supraventricular tachycardia; VT: ventricular tachycardia
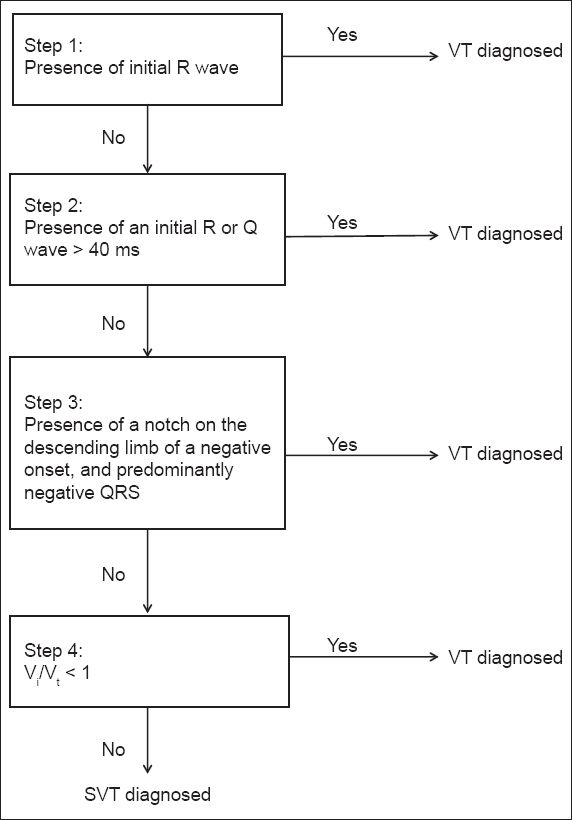
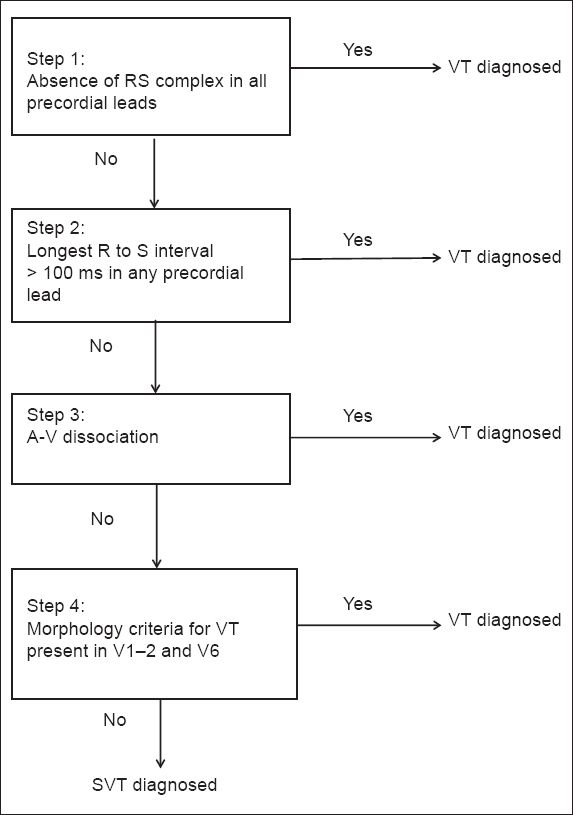
Fig. 4
The Brugada algorithm(3) used for the diagnosis of ventricular tachycardia. SVT: supraventricular tachycardia; VT: ventricular tachycardia
In Vereckei et al’s algorithm,(7) diagnosis of VT is made when any one of criteria 1 to 3 is present. In criterion 1, VT is diagnosed in the presence of initial R wave in lead aVR, as was found in our patient. If an initial R wave is absent, criterion 2 is invoked; it looks for the presence of initial R or Q wave > 40 ms. If this is absent, then the presence of notching on the initial downstroke of predominantly negative QRS complex in aVR is looked for (i.e. criterion 3). If all three criteria are absent, the initial (Vi) and terminal (Vt) ventricular activation velocity ratio (Vi/Vt) is calculated. This is done by measuring (in mV) the vertical excursion during Vi and Vt 40 ms of QRS complex. The sum of their absolute values (regardless of polarity) is used for the values of Vi and Vt.
The Brugada algorithm also comprises four steps (
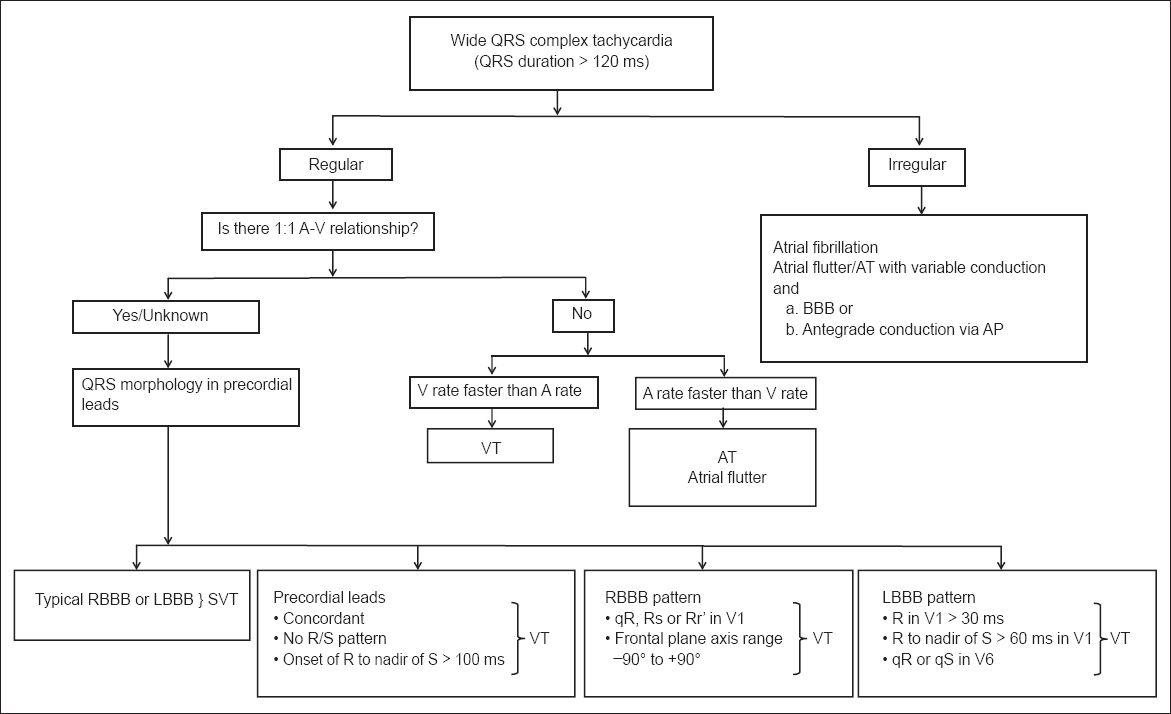
Fig. 5
The ventricular tachycardia criteria published by the American College of Cardiology.(8) AP: accessory pathway; AT: atrial tachycardia; BBB: bundle branch block; LBBB: left bundle branch block; RBBB: right bundle branch block; SVT: supraventricular tachycardia; VT: ventricular tachycardia
In summary, we presented a case of atrial flutter and VT arising spontaneously and simultaneously in a patient with non-ischaemic cardiomyopathy.