Author Information >Copyright and License information >
1Research Division, Institute of Mental Health, Singapore Correspondence: Dr Mythily Subramaniam, Director, Research Division, Institute of Mental Health, Buangkok Green Medical Park, 10 Buangkok View, Singapore 539747. Mythily@imh.com.sg
As populations age globally and the burden of chronic illnesses increases, valid measures of disability are needed for assessment in the older adult population. The aim of the current analysis was to explore the psychometric properties and validity of the 12-item World Health Organization Disability Assessment Schedule 2.0 (WHODAS 2.0) in an epidemiological survey of older adults in Singapore.
METHODS:
The study comprised secondary data analysis of the Well-being of the Singapore Elderly study. Inclusion criteria for the study were Singapore residents (Singapore citizens and permanent residents) aged 60 years and above. The 12-item interviewer-administered version of the WHODAS 2.0 was used to assess disability in the study. Data on cognition, health status and sociodemographic information were collected. Depression was assessed using the Automated Geriatric Examination for Computer Assisted Taxonomy.
RESULTS:
The study found a one-factor model solution for WHODAS 2.0 with a high internal consistency of all items. The internal consistency for the overall scale was 0.92. The WHODAS 2.0 score positively correlated with multimorbidity, perceived overall health status, depression and subsyndromal depression. There was a significant inverse association between the WHODAS 2.0 score and the cognitive status. After adjustment for all sociodemographic variables in the multiple linear regression analysis, these measures remained significantly associated with the WHODAS 2.0 score.
CONCLUSION:
WHODAS 2.0 was found to be a valid measure of disability among older adults. However, further research is required to determine its usefulness as a responsive instrument that can detect change following interventions.
The World Health Organization’s International Classification of Functioning, Disability, and Health (WHO ICF)(1) defines disability as “a difficulty in functioning at the body, person, or societal levels, in one or more life domains, as experienced by an individual with a health condition in interaction with contextual factors”.(2) Disability has increasingly become an important indicator of disease burden and for evaluating the effectiveness of health interventions. However, both defining and measuring disability are difficult. The WHO ICF presents a biopsychosocial model of functioning and disability that provides a framework to assess the consequences of a disease in three dimensions: impairments (of functioning), activity limitations (related to tasks) and restriction of participation (affecting life experiences). The World Health Organization Disability Assessment Schedule 2.0 (WHODAS 2.0)(3) was created to assess disability based on this framework.(4)
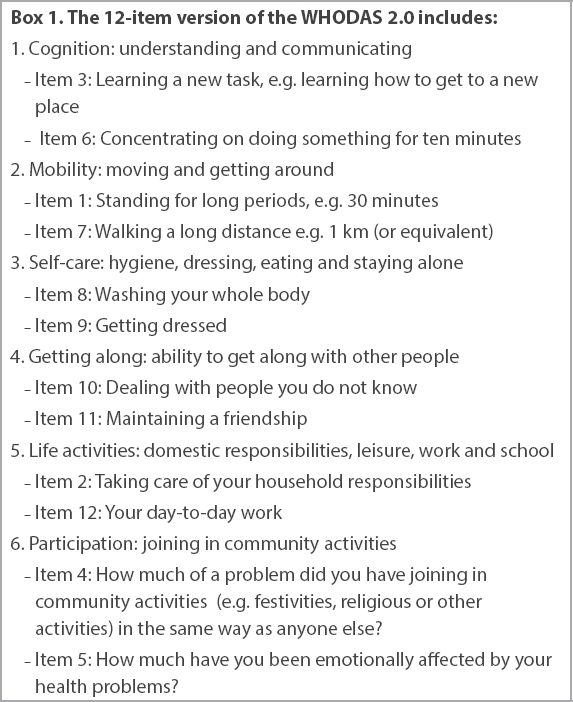
The WHODAS 2.0 is a 36-item, multidimensional instrument developed by the Assessment, Classification, and Epidemiology group of WHO, which was field tested in 16 languages in 14 different countries to ensure cross-cultural relevance.(5) It has the added advantage of being able to identify the consequences of any type of disorder that has an impact on functioning, treating all disorders at parity when determining level of functioning.(6) Several studies have analysed the psychometric properties of the 36-item WHODAS 2.0 in different patient populations, including those with inflammatory arthritis,(7) systemic sclerosis,(8) psychosis(6) and chronic diseases,(9) and those undergoing rehabilitation.(10) A shorter version of the instrument with 12 items has also been developed(11) and is recommended for epidemiological studies. Since the 36-item version of the scale measures six domains, the two most significant items from each domain were chosen for the 12-item version (Box 1).
Box 1
The 12-item version of the WHODAS 2.0 includes:
The shortened version has been validated in various populations, including community samples,(12) people with disability,(13) people with Huntington’s disease,(14) primary care patients with depression(15) and patients with chronic musculoskeletal pain,(16) where the instrument demonstrated high internal consistency, moderate-to-good test-retest reliability, and good concurrent validity against disease-specific and generic disability assessments.
The number of older adults (i.e. those aged 60 years or older) has increased in recent years across the world, and this growth is projected to further increase in the future. From 2015 to 2030, it is projected to grow by 56%, with older adults making up to two billion of the world’s population by 2050.(17) This increase in the number of older adults is expected to be fastest in Latin America and the Caribbean, followed by Asia. The disability burden due to chronic non-communicable disorders such as depression, dementia and hearing loss is expected to be considerable in this population and, therefore, understanding levels and trends in the prevalence and severity of disability is necessary for service planning and public policy.(17)
Singapore is a highly urbanised country in Southeast Asia with a resident population of 3.8 million,(18) of whom 74.3% are Chinese, 13.4% are Malay, 9.0% are Indian and 3.2% are of other ethnicities. According to recent population data, the proportion of older adults (defined as persons aged ≥ 65 years) in Singapore has increased from 8.5% in 2007 to 13.0% in 2017.(19) The average life expectancy in Singapore is among the highest in the world, with an average of 83.2 years at birth.(20) Generally, in countries with higher life expectancies, the number of healthy life years lost due to disability also tends to be greater.(17) Thus, given the high life expectancy and the rapidly ageing population, valid measures of disability are needed for assessment in the older adult population. Thus, the aim of the current analysis was to explore the psychometric properties and validity of the 12-item WHODAS 2.0 in an epidemiological survey of older adults in Singapore. We hypothesised that those who have multimorbidity, are diagnosed with depression or subsyndromal depression and endorse a poor overall health status would be associated with higher disability scores, while those who have higher cognitive scores would be associated with low disability.
METHODS
The present study comprised secondary data analysis of the Well-being of the Singapore Elderly (WiSE) study. The WiSE study is a comprehensive single-phase, cross-sectional survey to determine the prevalence of dementia among older adults (aged ≥ 60 years) in Singapore that was conducted between August 2012 and December 2013. The protocol designed by the 10/66 dementia research group was adopted for the study.(21) Inclusion criteria for the WiSE study comprised Singapore residents (including Singapore citizens and permanent residents) aged ≥ 60 years who were living in Singapore at the time of the survey. The study was a household survey and all respondents were contacted at their household addresses. However, if the interviewer was informed by the family members that the potential respondent was in a day care centre during the day or in a nursing home or had been hospitalised, these cases were also followed up. For those attending day care centres, interviews were conducted during the weekend or later in the evening at the convenience of the respondent. For those who were hospitalised, interviews were scheduled after their discharge. For older adults in nursing homes, if the families provided the contact details and permission to interview them and if the respondents were subsequently willing to participate, the interviews were done in the nursing home.
A target sample size of 2,500 was estimated to be adequate for the study. Respondents were randomly selected via a national registry that maintains the names and sociodemographic details such as age, gender, ethnicity and addresses of all residents in Singapore. The study also included an informant who was defined as the person who knew the older adult best. If respondents were unable to answer the questions, the informant would then be asked the questions. All respondents and informants provided written informed consent. In the case of respondents who were unable to provide informed consent, written informed consent was taken from their legally acceptable representative/next of kin. The study was approved by the relevant institutional ethics review boards (National Healthcare Group Domain Specific Review Board and SingHealth Centralised Institutional Review Board). The study has been described in further detail in an earlier article.(22)
Respondent data from the following questionnaires were included for analysis.
Sociodemographic questionnaire: This questionnaire collected information about age, gender, ethnicity, marital status, employment status and educational level.
The 12-item WHODAS 2.0: The 12-item interviewer-administered version of the WHODAS 2.0 was used to assess disability in the study.(11) For each item, individuals had to estimate difficulties due to health problems during the previous 30 days from ‘none = 1’ to ‘extreme/cannot do = 5’.
Cognitive test battery: The battery comprised the Community Screening Instrument for Dementia (CSI ‘D’),(23) which incorporated the Consortium to Establish a Registry for Alzheimer’s Dementia (CERAD) animal naming verbal fluency task. The test also included the modified CERAD ten-word list learning task with delayed recall.(24) This generated the global cognitive score (COGSCORE), an item-weighted total score of the cognitive test.
Assessment of depression: Depression was assessed via a standardised interview and a computerised diagnostic system – the Automated Geriatric Examination for Computer Assisted Taxonomy (AGECAT).(25) Similar to an earlier study by Guerra et al,(26) we used the Stage 1 Geriatric Mental State (GMS)-AGECAT depression syndrome for diagnosis. Accordingly, study participants were classified into depression (cases), subsyndromal depression (subcases) and non-cases. The assessment of depression in this study is described in detail in an earlier article.(27)
Health status questionnaires: This included a chronic conditions checklist, wherein respondents were asked whether they had any of the following chronic medical conditions: high blood pressure; heart trouble (including heart attack, angina, heart failure and valve disease); stroke; transient ischaemic attacks; diabetes mellitus; arthritis or rheumatism; chronic obstructive pulmonary disease; breathlessness or asthma; and cancer. Multimorbidity was defined as two or more of these chronic conditions being present in that one person at the same time.(28)
Overall health status: This was measured by asking the respondents a single question, “How would you rate your overall health in the past 30 days?” The five-point response scale ranged from 0 to 4, where 0 = very good, 1 = good, 2 = moderate, 3 = bad and 4 = very bad. Higher scores indicated poor health status.
The instruments were available in Chinese and Tamil, and translated into Malay.(22) For the three dialects (i.e. Hokkien, Teochew and Cantonese), each question was transcribed using an amalgamation of hanyu pinyin and original notation to guide interviewers on how the questions should be asked. The transcription was done and refined by a panel of expert dialect speakers. As the trained interviewers who conducted these interviews were also fluent in the dialect, the transcripts served as guides to how the questions were asked. The choice of language was left to the respondents, who were asked to choose the language that they were most comfortable conversing in.
The field interviewers were trained extensively for the study. For the first week, they received training on the study procedures and administration of the questionnaires in English. This was followed by two days of training in the three local languages, and another day of training for those conducting interviews in dialects. Inter-rater reliability was not conducted; however, interviewers were trained to ask questions and follow-up probes in exactly the same way using a combination of demonstrations by the research staff and video-recorded interviews conducted by clinicians (for training purposes), and through assessing the interviewers for consistency and understanding by asking each of them to administer part of the questionnaire section by section in small groups. Interviewers who did not display the required competency were not allowed to proceed with the field work. Field observations were also carried out by the research staff to ensure standards were maintained during respondent interviews.
Statistical analyses were carried out using the SAS Software version 9.2 (SAS Institute Inc, Cary, NC, USA) and Mplus version 7.2.(29) To ensure that the survey findings were representative of the older adult population in Singapore, all estimates were analysed using survey weights to adjust for oversampling, non-response and post-stratification according to age and ethnicity of the Singapore population (aged ≥ 60 years) for the year 2013. Weighted mean and standard error of mean were calculated for continuous variables, while frequencies and percentages were calculated for categorical variables. In order to determine the dimensionality of the instrument, the participants were randomly divided into two halves for the purpose of cross-sample validation. We analysed the data using exploratory factor analysis (EFA) among a random half of the sample (n = 1,282) in order to identify the number of underlying factors, with all rotated loadings freely estimated using an oblique geomin rotation method. EFA was performed on polychoric correlation matrix using Mplus version 7.0 with the weighted least squares with mean and variance adjusted estimator, which is considered a robust estimator for handling ordinal indicators such as Likert-type ratings. Monte Carlo simulations have found that the weighted least squares estimator performed well in models with ordinal indicators with highly skewed distribution, including high ceiling effects, due to many zeros.(30-33) This was followed by confirmatory factor analysis (CFA) (n = 1,282) to confirm the factor structure yielded by EFA with the second half of the sample.
In EFA, several criteria were used to determine the number of factors such as eigenvalue-based procedures, including the number of eigenvalues > 1 and scree plot, pattern of loadings on each factor (i.e. number of non-loading or double-loading items), and interpretability of each solution. We also used several criteria to determine the best-fit model in both EFA and CFA. We chose 0.4 as a cut-off for size of loading to be interpreted as acceptable.(34) Overall model fit was measured using a range of goodness-of-fit statistics based on the following criteria: the comparative fit index (CFI), Tucker-Lewis index (TLI) and root mean square error of approximation (RMSEA). The cut-off values suggested by Hu and Bentler(35) were used ‒ a cut-off value of close to 0.95 for TLI and CFI, and values < 0.08 or < 0.06 for the RMSEA support acceptable and good model fit, respectively.(36) The best-fitting model from CFA was further analysed using a multigroup CFA to examine measurement invariance across gender, the three ethnic groups (Chinese, Malay and Indian) and age groups (60–74, 75–84 and 85+ years). We used a series of nested multigroup CFA models with increasing parameter constraints to test for configural, metric and scalar invariance. Configural invariance was tested in a model where the factorial structure was invariant across groups with no equality constraints imposed, relying on common model fit indices. Metric invariance was tested by fitting models where factor loadings on respective items were constrained to be equal across groups. Scalar invariance was tested by additionally constraining intercepts to be equal across groups.(34) Cronbach’s alpha coefficient was computed to assess the internal consistency of the questionnaire. Convergent and divergent validity was examined using simple linear regression followed by multiple linear regression analyses after controlling for sociodemographic variables, including age, gender, ethnicity, marital status, employment and education status.
RESULTS
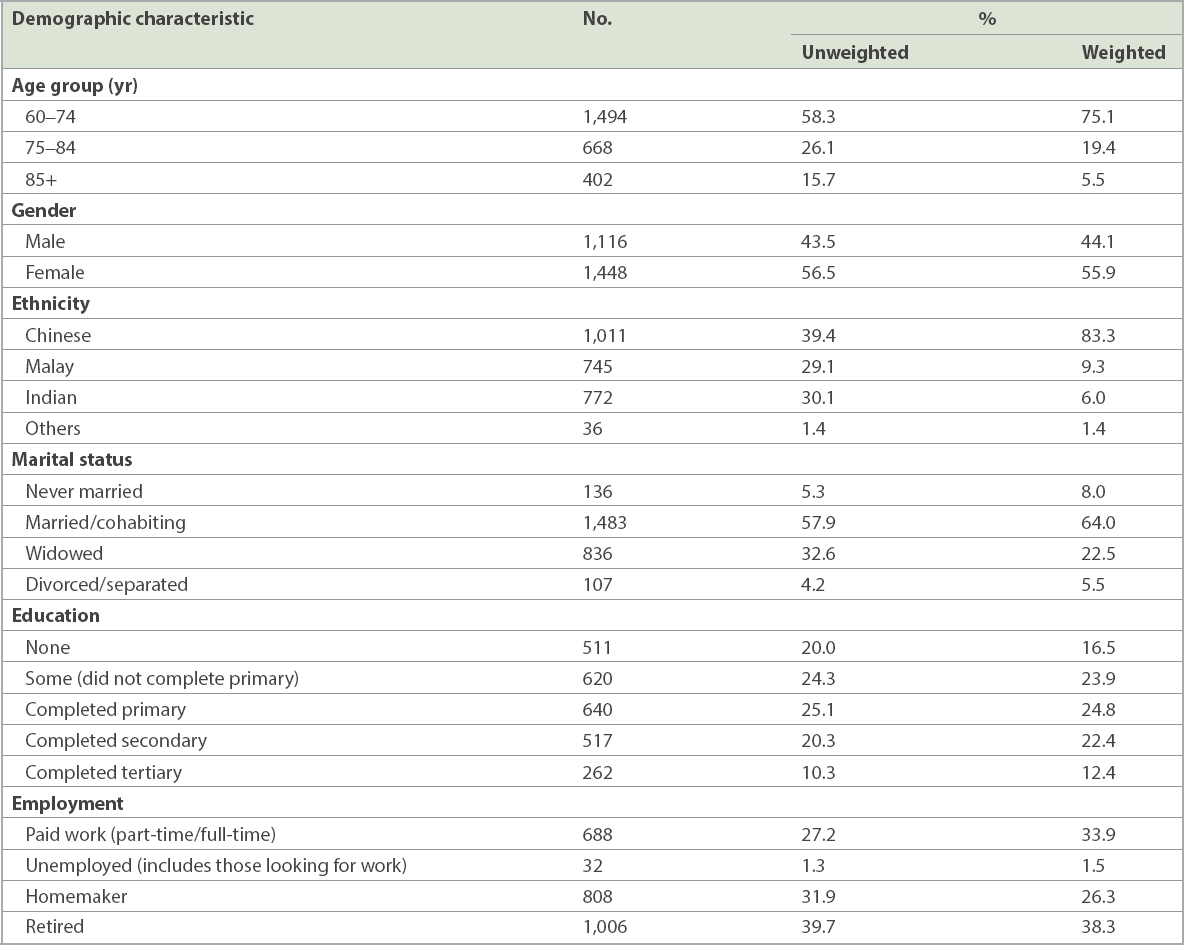
The sociodemographic characteristics of the respondents are shown in Table I. A total of 2,564 respondents were included in the present study. Of these, 18 respondents completed the study while they were in nursing homes. The sample comprised 55.9% female and 44.1% male respondents. The majority of the sample were aged 60–74 years (75.1%), of Chinese ethnicity (83.3%) and currently married/cohabiting (64.0%).
Table I
Sociodemographic characteristics of the sample (n = 2,564).
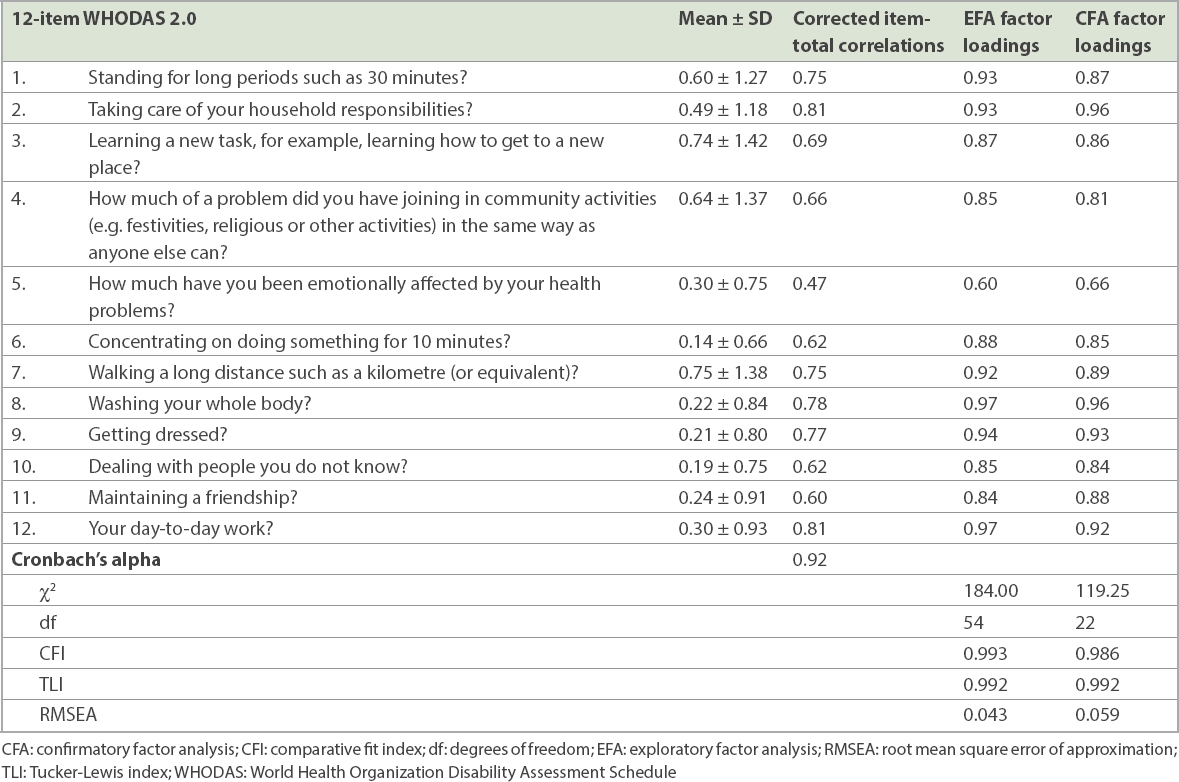
Inspection of the scree plot and eigenvalues > 1.0 indicated that a one-factor solution was appropriate (the first to fourth eigenvalues were 9.10, 0.85, 0.51 and 0.47). Table II shows the factor loadings and model fits for the EFA and CFA models with one-factor model solution. In EFA, all 12 items loaded strongly on the factor, with all factor loadings > 0.6. The fit indices were an excellent fit: χ2(df) = 119.25(22), CFI = 0.986, TLI = 0.992, RMSEA = 0.059, with high factor loadings (λ range 0.66-0.96). The internal consistency for the overall scale was 0.92.
Table II
Means, standard deviations (SDs), Cronbach's alpha, factor loadings and fit indices of the WHODAS 2.0 (n = 2,564).
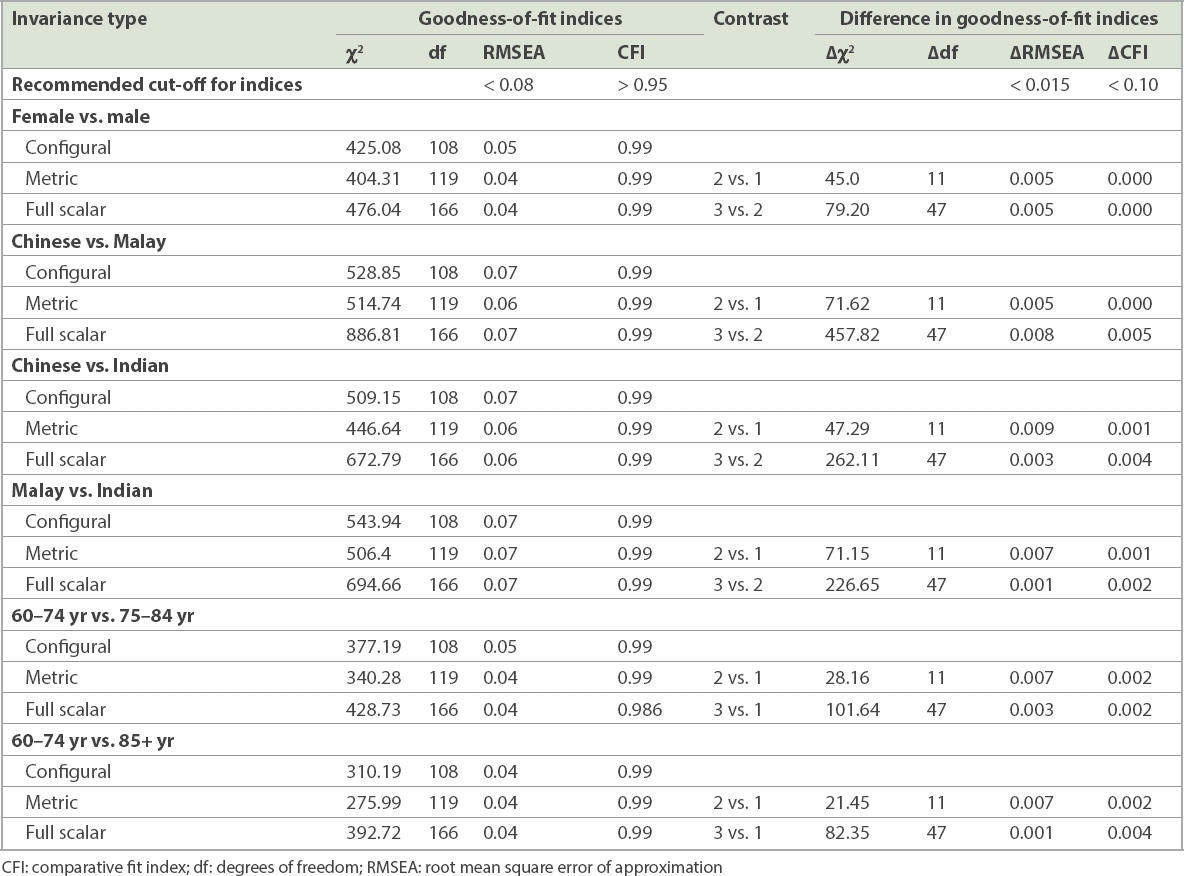
Table III shows the results of the model indices for measurement invariance across gender, ethnicity (Chinese vs. Malay, Chinese vs. Indian and Malay vs. Indian) and age groups (60-74, 75-84 and 85+ years). We used the best-fitting factorial structure derived from EFA and CFA modelling to examine measurement invariance across gender, ethnicity and age groups. Multiple-group CFA (MG-CFA) demonstrated good data fit for configural invariance across gender, ethnicity and age groups, indicating that the best-fitting factorial structure was confirmed within these subgroups. Furthermore, we found full metric and scalar invariance with satisfactory model indices. MG-CFA findings confirmed full configural, metric and scalar invariance for the 12-item WHODAS 2.0 score in this sample.
Table III
Model indices for measurement invariance across gender, ethnicity and age groups.
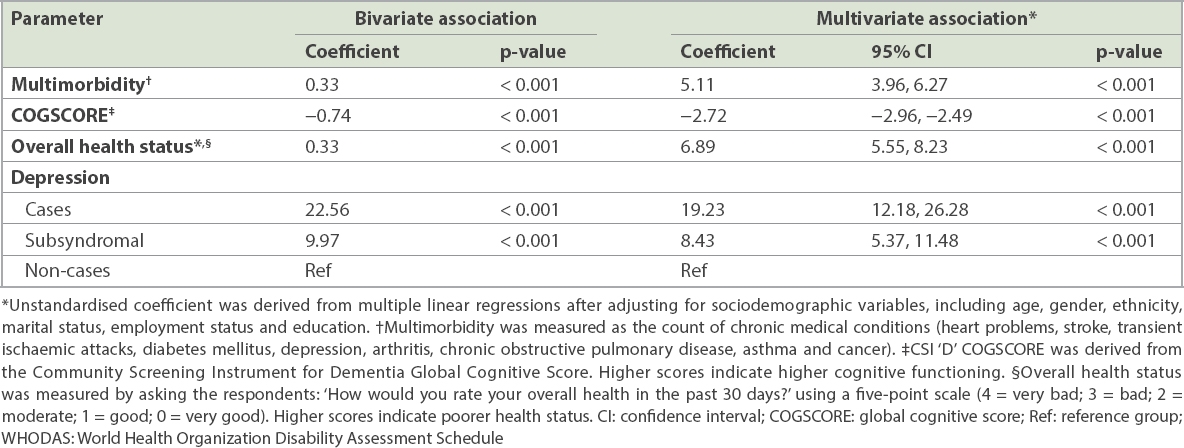
Table IV shows the correlation coefficients between the WHODAS 2.0 score and other scales. The WHODAS 2.0 score positively correlated with multimorbidity, perceived overall health status, depression and subsyndromal depression. There was a significant inverse association between the WHODAS 2.0 score and COGSCORE. After adjustment for all sociodemographic variables in the multiple linear regression analysis, these measures remained significantly associated with the WHODAS 2.0 score.
Table IV
Correlations between the WHODAS 2.0 score and other measures.
DISCUSSION
The study found a one-factor model solution for WHODAS 2.0, with a high internal consistency of all items, which confirms the findings of other studies that have validated WHODAS 2.0.(12,15,37,38) However, Saltychev et al(16) identified two retained factors with eigenvalues > 1 after EFA, with the main factor being responsible for more than 81% of the variation. Similar to the studies by Luciano et al(15) and Schiavolin et al,(39) we found the lowest loadings for Items 5 (‘How much have you been emotionally affected by your health problems?’) and 11 (‘Maintaining a friendship’).
The current study is one of the few that has validated the WHODAS 2.0 in older adults. Sousa et al,(38) who evaluated the scale among older adults living in seven low- and middle-income countries as part of the 10/66 study, similarly identified a one-factor solution in most sites; however, data from a few countries (Cuba, Dominican Republic, rural China and rural India) supported a two-factor solution. The authors concluded that the underlying constructs could not be interpreted other than that based on the item difficulty of the associated items. Internal consistency in the 10/66 study ranged from 0.90 to 0.97 by site, which is similar to that identified in the current study (i.e. 0.92).
We also found full configural, metric and scalar invariance for the 12-item WHO-DAS 2.0 in this sample. Measurement invariance determines the extent to which a measure demonstrates construct comparability across different groups such as age, gender and ethnicity, and is therefore a prerequisite for making meaningful comparisons between independent groups. Measurement invariance of the WHODAS 2.0 was also demonstrated by Sousa et al(38) among older adults, both in terms of item calibration and for underlying factor structure and factor loading. The invariance identified in our study has practical utility for clinicians and researchers who are interested in using the WHODAS 2.0 to assess disability among older adults in Singapore’s multiethnic population.
The current study also found support for the convergent validity of the 12-item WHODAS 2.0. The WHODAS 2.0 score was positively correlated with perceived overall health status scores, multimorbidity, depression, as well as subsyndromal depression. Older adults with higher disability reported poorer overall health. Other studies have found a significant negative association between disability and health-related quality of life.(7,8,15) Luciano et al(15) found a significant negative association between disability scores and EuroQoL-5 Dimensions (EQ-5D),(40) while Hudson et al(8) found that the WHODAS 2.0 was moderately and negatively associated with the physical and mental component of the Medical Outcomes Short Form-36 questionnaire.(41) Carlozzi et al(14) also found evidence for convergent validity, with the WHODAS 2.0 demonstrating moderately significant correlations with other general measures of health-related quality of life, including the EQ-5D.(40) The prevalence of multimorbidity was 51.5% in this sample as established by a previous study,(28) and the current study found a significant positive association between multimorbidity, as measured by the count of chronic medical conditions, and disability. Not many studies have examined disability among those with multimorbidity; Garin et al(42) reported similar results when assessing the association between multimorbidity and disability using the WHODAS 2.0 questionnaire. Disability was also significantly correlated with both depression and subsyndromal depression. This is in line with previous studies by Luciano et al(15) and Chwastiak and Von Korff,(43) who showed a strong correlation between WHODAS 2.0 scores and depression as measured by the Patient Health Questionnaire-9.(44) There was a significant inverse association between WHODAS 2.0 score and COGSCORE, which has been reported previously in this population.(45) Several cross-sectional studies have found a correlation between cognitive status and functional disability in old age,(46,47) with some studies indicating a bidirectional relationship between the two.(48)
There are some limitations to the current study. As this is a secondary analysis of data from a cross-sectional study, test-retest reliability and sensitivity to change of the 12-item WHODAS 2.0 were not ascertained in the study and health-related quality of life was assessed by a single question instead of using a structured questionnaire. The WHODAS 2.0 and other relevant questionnaires were administered to the informant when the older adult respondent was cognitively incapable of answering the questions. While the informant was someone who knew the respondent best, we were unable to verify the accuracy of the responses in any way. The American Psychiatric Association has also recommended that “if the adult individual is of impaired capacity and unable to complete the form (e.g. a patient with dementia), a knowledgeable informant may complete the proxy-administered version of the measure”.(49) The proxy-administered version of the WHODAS 2.0 has been validated by Downing et al among patients with Huntington’s disease.(50) However, the current study did not establish the concordance between self and proxy reports of disability or other questionnaires. The choice of methods used in the current study to determine the number of factors to rotate can also be debated. In the present study, the factors were determined based on eigenvalues > 1 and the scree plot methods, as well as the interpretability of each factor solution and fit indices criterion, including CFI, TLI and RMSEA. In addition to these methods, the factor solution was cross-validated with CFA using the second half of the sample. This approach has been recommended by other researchers and methodologists.(34,51) We would like to highlight that, while parallel analysis (PA) has been reported to be superior to eigenvalues > 1 and scree plot,(52) other researchers have suggested that the performance of the PA method is greatly dependent on the magnitude of the correlation among factors and the number of items. For example, a recent simulation study by Yang and Xia(53) has shown that when the number of items was 12 and the correlation factors were increased, eigenvalue > 1 performed better than PA. Hence, it is important to acknowledge that no method should be treated as inviolable.(54)
It may also be argued that when using factor analysis to validate a measure, samples need to be representative of the diversity within the construct under investigation (i.e. disability in the case of the current study) rather than representative of the general population. However, as stated by other researchers, WHODAS 2.0 is useful for assessing health and disability levels in the general population and in clinical groups,(5) and establishing population norms enables comparisons of subpopulations and the general population. Thus, it is important that the scale be validated in both general populations, as well as in specific groups with disability. The strengths of the current study include the large, multiethnic sample and the use of structured instruments to measure cognition and depression.
In conclusion, this study has demonstrated that the WHODAS 2.0 is a valid and reliable measure of disability among older adults in a multiethnic Asian population. However, further research is required to determine the usefulness of the WHODAS 2.0 as a responsive instrument that can detect change following interventions.
ACKNOWLEDGEMENTS
The WiSE study was funded by the Ministry of Health, Singapore, and the Singapore Millennium Foundation of the Temasek Trust. The funders had no role in study design, data collection and analysis, decision to publish and preparation of the manuscript.
References World Health OrganizationInternational Classification of Functioning, Disability and Health (ICF). 2001;Geneva WHO Library Cataloguing in-Publication Data. Leonardi M, Bickenbach J, Ustun TB, Kostanjsek N, Chatterji S.MHADIE Consortium. The definition of disability:what is in a name?.Lancet. 2006;368:1219-21. World Health OrganizationWHODAS Disability Assessment Schedule 2.0 (WHODAS 2.0). Available at: https://www.who.int/classifications/icf/whodasii/en/. Accessed May 28 2019. Cieza A, Stucki G.Understanding functioning, disability, and health in rheumatoid arthritis:the basis for rehabilitation care.Curr Opin Rheumatol. 2005;17:183-9. Ustün TB, Chatterji S, Kostanjsek N, et al. WHO/NIH Joint Project. Developing the World Health Organization Disability Assessment Schedule 2.0.Bull World Health Organ. 2010;88:815-23. Chopra PK, Couper JW, Herrman H.The assessment of patients with long-term psychotic disorders:application of the WHO Disability Assessment Schedule II.Aust N Z J Psychiatry. 2004;38:753-9. Baron M, Schieir O, Hudson M, et al. The clinimetric properties of the World Health Organization Disability Assessment Schedule II in early inflammatory arthritis.Arthritis Rheum. 2008;59:382-90. Hudson M, Steele R, Taillefer S, Baron M.Canadian Scleroderma Research. Quality of life in systemic sclerosis:psychometric properties of the World Health Organization Disability Assessment Schedule II.Arthritis Rheum. 2008;59:270-8. Garin O, Ayuso-Mateos JL, Almansa J, et al. MHADIE Consortium. Validation of the “World Health Organization Disability Assessment Schedule, WHODAS-2”in patients with chronic diseases.Health Qual Life Outcomes. 2010;8:51. Pösl M, Cieza A, Stucki G.Psychometric properties of the WHODAS II in rehabilitation patients.Qual Life Res. 2007;16:1521-31. Rehm J, Üstün TB, Saxena S, et al. On the development and psychometric testing of the WHO screening instrument to assess disablement in the general population.Int J Methods Psychiatr Res. 1999;8:110-22. MacLeod MA, Tremblay PF, Graham K, et al. Psychometric properties and a latent class analysis of the 12-item World Health Organization Disability Assessment Schedule 2.0 (WHODAS 2.0) in a pooled dataset of community samples.IntJ Methods Psychiatr Res. 2016;25:243-54. Xenouli G, Xenoulis K, Sarafis P, Niakas D, Alexopoulos EC.Validation of the World Health Organization Disability Assessment Schedule (WHODAS II) in Greek and its added value to the Short Form 36 (SF-36) in a sample of people with or without disabilities.Disabil Health J. 2016;9:518-23. Carlozzi NE, Kratz AL, Downing NR, et al. Validity of the 12-item World Health Organization Disability Assessment Schedule 2.0 (WHODAS 2.0) in individuals with Huntington disease (HD).Qual Life Res. 2015;24:1963-71. Luciano JV, Ayuso-Mateos JL, Fernández A, et al. Psychometric properties of the twelve item World Health Organization Disability Assessment Schedule II (WHODAS II) in Spanish primary care patients with a first major depressive episode.J Affect Disord. 2010;121:52-8. Saltychev M, Bärlund E, Mattie R, et al. A study of the psychometric properties of 12-item World Health Organization Disability Assessment Schedule 2.0 in a large population of people with chronic musculoskeletal pain.Clin Rehabil. 2017;31:262-72. United Nations Department of Economic and Social Affairs, Population DivisionWorld Population Ageing 2015. Available at: http://www.un.org/en/development/desa/population/publications/pdf/ageing/WPA2015_Report.pdf.. Accessed May 28 2019. Statistics SingaporePopulation Trends 2018. Available at: https://www.singstat.gov.sg/-/media/files/publications/population/population2018.pdf. Accessed May 28 2019. Statistics SingaporeKey Indicators on the Elderly, Annual. Available at: https://www.tablebuilder.singstat.gov.sg/publicfacing/createDataTable.action?refId=14914. Accessed May 28 2019. Statistics SingaporeDeath and Life Expectancy. Available at: https://www.singstat.gov.sg/find-data/search-by-theme/population/death-and-life-expectancy/latest-data. Accessed on May 28 2019. Prince M, Ferri CP, Acosta D, et al. The protocols for the 10/66 dementia research group population-based research programme.BMC Public Health. 2007;7:165. Subramaniam M, Chong SA, Vaingankar JA, et al. Prevalence of dementia in people aged 60 years and above:results from the WiSE study.J Alzheimers Dis. 2015;45:1127-38. Hall KS, Hendrie HH, Brittain HM, et al. The development of a dementia screening interview in two distinct languages.Int J Methods Psychiatr Res. 1993;3:1-28. Ganguli M, Chandra V, Gilby JE, et al. Cognitive test performance in a community-based nondemented elderly sample in rural India:the Indo-US Cross-National Dementia Epidemiology Study.Int Psychogeriatr. 1996;8:507-24. Copeland JR, Kelleher MJ, Kellett JM, et al. A semi-structured clinical interview for the assessment of diagnosis and mental state in the elderly:the Geriatric Mental State Schedule I. Development and reliability.Psychol Med. 1976;6:439-49. Guerra M, Ferri CP, Sosa AL, et al. Late-life depression in Peru, Mexico and Venezuela:the 10/66 population-based study.Br J Psychiatry. 2009;195:510-5. Subramaniam M, Abdin E, Sambasivam R, et al. Prevalence of depression among older adults-results from the Well-being of the Singapore Elderly Study.Ann Acad Med Singapore. 2016;45:123-33. Picco L, Achilla E, Abdin E, et al. Economic burden of multimorbidity among older adults:impact on healthcare and societal costs.BMC Health Serv Res. 2016;16:173. Muthén LK, Muthén BO. Mplus User's Guide7th edLos Angeles Muthén &Muthén; 1998-2010. Beauducel A, Herzberg PY.On the performance of maximum likelihood versus means and variance adjusted weighted least squares estimation in CFA.Struct Equ Modeling. 2006;13:186-203. Flora DB, Curran PJ.An empirical evaluation of alternative methods of estimation for confirmatory factor analysis with ordinal data.Psychol Methods. 2004;9:466-91. Muthén BO, du Toit SHC, Spisic D.Robust inference using weighted least squares and quadratic estimating equations in latent variable modeling with categorical and continuous outcomes.Technical Report, University of California, Los Angeles. 1997;. Available at: https://www.statmodel.com/download/ Article_075.pdf. Accessed May 5 2020. Rhemtulla M, Brosseau-Liard PÉ, Savalei V.When can categorical variables be treated as continuous?A comparison of robust continuous and categorical SEM estimation methods under suboptimal conditions.Psychol Methods. 2012;17:354-73. Brown TA. Confirmatory Factor Analysis for Applied Research. 2006;New York, NY Guilford Press. Hu LT, Bentler PM.Cut off criteria for fit indexes in covariance structure analysis:conventional criteria versus new alternatives.Struct Equ Modeling. 1999;6:1-55. Browne MW, Cudeck R.Bollen KA, Long JS.Alternative Ways of Assessing Model Fit.Testing Structural Equation Models1993:Newbury Park, CA Sage136-62. Chisolm TH, Abrams HB, McArdle R, Wilson RH, Doyle PJ.The WHODAS II:psychometric properties in the measurement of functional health status in adults with acquired hearing loss.Trends Amplif. 2005;9:111-26. Sousa RM, Dewey ME, Acosta D, et al. Measang disability across cultures--the psychometric properties of the WHODAS II in older people from seven low- and middle-income countries. The 10/66 Dementia Research Group population-based survey.Int J Methods Psychiatr Res. 2010;19:1-17. Schiavolin S, Ferroli P, Acerbi F, et al. Disability in Italian neurosurgical patients:validity of the 12-item World Health Organization Disability Assessment Schedule.Int J Rehabil Res. 2014;37:267-70. Rabin R, de Charro F.EQ-5D:a measure of health status from the EuroQol Group.Ann Med. 2001;33:337-43. Ware JE, Snow KK, Kosinski M, Gandek B.New Engl and Medical Center Hospital Health Institute.SF-36 health survey:manual and interpretation guide. 1993;Boston The Health Institute, New England Medical Center. Garin N, Olaya B, Moneta MV, et al. Impact of multimorbidity on disability and quality of life in the Spanish older population.PLoS One. 2014;9:e111498. Chwastiak LA, Von Korff M.Disability in depression and back pain:evaluation of the World Health Organization Disability Assessment Schedule (WHODAS II) in a primary care setting.J Clin Epidemiol. 2003;56:507-14. Kroenke K, Spitzer RL, Williams JB.The PHQ-9:validity of a brief depression severity measure.J Gen Intern Med. 2001;16:606-13. Mahesh M, Abdin E, Vaingankar JA, et al. Disability in Singapore's elderly population.Ann Acad Med Singapore. 2016;45:284-96. Bassett SS, Folstein MF.Cognitive impairment and functional disability in the absence of psychiatric diagnosis.Psychol Med. 1991;21:77-84. Moritz DJ, Kasl SV, Berkman LF.Cognitive functioning and the incidence of limitations in activities of daily living in an elderly community sample.Am J Epidemiol. 1995;141:41-9. Black SA, Rush RD.Cognitive and functional decline in adults aged 75 and older.J Am Geriatr Soc. 2002;50:1978-86. American Psychiatric AssociationOnline Assessment Measures:WHODAS 2.0 (World Health Organization Disability Schedule 2.0, 36-item version, proxy-administered). Available at: https://www.psychiatry.org/psychiatrists/practice/dsm/educational-resources/assessment-measures. Accessed December 29 2017. Downing NR, Kim JI, Williams JK, et al. PREDICT-HD Investigators and Coordinators of the Huntington Study Group. WHODAS 2.0 in prodromal Huntington disease: measures of functioning in neuropsychiatric disease.Eur J Hum Genet. 2014;22:958-63. Asparouhov T, Muthén B.Exploratory structural equation modeling.Struct Equ Modeling. 2009;16:397-438. Gaskin CJ, Happell B.On exploratory factor analysis:a review of recent evidence, an assessment of current practice, and recommendations for future use.Int J Nurs Stud. 2014;51:511-21. Yang Y, Xia Y.On the number of factors in exploratory factor analysis for ordered categorical data.Behav Res Methods. 2015;47:756-72. Garrido LE, Abad FJ, Ponsoda V.Are fit indices really fit to estimate the number of factors with categorical variables?Some cautionary findings via Monte Carlo simulation.Psychol Methods. 2015;21:93-111.
REFERENCES:
1. World Health Organization. International Classification of Functioning, Disability and Health (ICF). Geneva: WHO Library Cataloguing in-Publication Data; 2001.
2. Leonardi M, Bickenbach J, Ustun TB, Kostanjsek N, Chatterji S; MHADIE Consortium. The definition of disability: what is in a name? Lancet 2006; 368:1219-21. https://doi.org/10.1016/S0140-6736(06)69498-1
4. Cieza A, Stucki G. Understanding functioning, disability, and health in rheumatoid arthritis: the basis for rehabilitation care. Curr Opin Rheumatol 2005; 17:183-9. https://doi.org/10.1097/01.bor.0000151405.56769.e4
PMid:15711233
5. Ustün TB, Chatterji S, Kostanjsek N, et al; WHO/NIH Joint Project. Developing the World Health Organization Disability Assessment Schedule 2.0. Bull World Health Organ 2010; 88:815-23. https://doi.org/10.2471/BLT.09.067231
PMid:21076562 PMCid:PMC2971503
6. Chopra PK, Couper JW, Herrman H. The assessment of patients with long-term psychotic disorders: application of the WHO Disability Assessment Schedule II. Aust N Z J Psychiatry 2004; 38:753-9. https://doi.org/10.1080/j.1440-1614.2004.01448.x
PMid:15324341
7. Baron M, Schieir O, Hudson M, et al. The clinimetric properties of the World Health Organization Disability Assessment Schedule II in early inflammatory arthritis. Arthritis Rheum 2008; 59:382-90. https://doi.org/10.1002/art.23314
PMid:18311751
8. Hudson M, Steele R, Taillefer S, Baron M; Canadian Scleroderma Research. Quality of life in systemic sclerosis: psychometric properties of the World Health Organization Disability Assessment Schedule II. Arthritis Rheum 2008; 59:270-8. https://doi.org/10.1002/art.23343
PMid:18240187
9. Garin O, Ayuso-Mateos JL, Almansa J, et al; MHADIE Consortium. Validation of the "World Health Organization Disability Assessment Schedule, WHODAS-2" in patients with chronic diseases. Health Qual Life Outcomes 2010; 8:51. https://doi.org/10.1186/1477-7525-8-51
PMid:20482853 PMCid:PMC2893517
10. Pösl M, Cieza A, Stucki G. Psychometric properties of the WHODAS II in rehabilitation patients. Qual Life Res 2007; 16:1521-31. https://doi.org/10.1007/s11136-007-9259-4
PMid:17828578
11. Rehm J, Üstün TB, Saxena S, et al. On the development and psychometric testing of the WHO screening instrument to assess disablement in the general population. Int J Methods Psychiatr Res 1999; 8:110-22. https://doi.org/10.1002/mpr.61
12. MacLeod MA, Tremblay PF, Graham K, et al. Psychometric properties and a latent class analysis of the 12-item World Health Organization Disability Assessment Schedule 2.0 (WHODAS 2.0) in a pooled dataset of community samples. Int J Methods Psychiatr Res 2016; 25:243-54. https://doi.org/10.1002/mpr.1523
PMid:27634553 PMCid:PMC6860311
13. Xenouli G, Xenoulis K, Sarafis P, Niakas D, Alexopoulos EC. Validation of the World Health Organization Disability Assessment Schedule (WHODAS II) in Greek and its added value to the Short Form 36 (SF-36) in a sample of people with or without disabilities. Disabil Health J 2016; 9:518-23. https://doi.org/10.1016/j.dhjo.2016.01.009
PMid:26996759
14. Carlozzi NE, Kratz AL, Downing NR, et al. Validity of the 12-item World Health Organization Disability Assessment Schedule 2.0 (WHODAS 2.0) in individuals with Huntington disease (HD). Qual Life Res 2015; 24:1963-71. https://doi.org/10.1007/s11136-015-0930-x
PMid:25636661 PMCid:PMC4497948
15. Luciano JV, Ayuso-Mateos JL, Fernández A, et al. Psychometric properties of the twelve item World Health Organization Disability Assessment Schedule II (WHODAS II) in Spanish primary care patients with a first major depressive episode. J Affect Disord 2010; 121:52-8. https://doi.org/10.1016/j.jad.2009.05.008
PMid:19464735
16. Saltychev M, Bärlund E, Mattie R, et al. A study of the psychometric properties of 12-item World Health Organization Disability Assessment Schedule 2.0 in a large population of people with chronic musculoskeletal pain. Clin Rehabil 2017; 31:262-72. https://doi.org/10.1177/0269215516631385
PMid:26851249
21. Prince M, Ferri CP, Acosta D, et al. The protocols for the 10/66 dementia research group population-based research programme. BMC Public Health 2007; 7:165. https://doi.org/10.1186/1471-2458-7-165
PMid:17659078 PMCid:PMC1965476
22. Subramaniam M, Chong SA, Vaingankar JA, et al. Prevalence of dementia in people aged 60 years and above: results from the WiSE study. J Alzheimers Dis 2015; 45:1127-38. https://doi.org/10.3233/JAD-142769
PMid:25672767
23. Hall KS, Hendrie HH, Brittain HM, et al. The development of a dementia screening interview in two distinct languages. Int J Methods Psychiatr Res 1993; 3:1-28.
24. Ganguli M, Chandra V, Gilby JE, et al. Cognitive test performance in a community-based nondemented elderly sample in rural India: the Indo-US Cross-National Dementia Epidemiology Study. Int Psychogeriatr 1996; 8:507-24. https://doi.org/10.1017/S1041610296002852
PMid:9147167
25. Copeland JR, Kelleher MJ, Kellett JM, et al. A semi-structured clinical interview for the assessment of diagnosis and mental state in the elderly: the Geriatric Mental State Schedule. I. Development and reliability. Psychol Med 1976; 6:439-49. https://doi.org/10.1017/S0033291700015889
PMid:996204
26. Guerra M, Ferri CP, Sosa AL, et al. Late-life depression in Peru, Mexico and Venezuela: the 10/66 population-based study. Br J Psychiatry 2009; 195:510-5. https://doi.org/10.1192/bjp.bp.109.064055
PMid:19949200 PMCid:PMC2915389
27. Subramaniam M, Abdin E, Sambasivam R, et al. Prevalence of depression among older adults-results from the Well-being of the Singapore Elderly Study. Ann Acad Med Singapore 2016; 45:123-33.
28. Picco L, Achilla E, Abdin E, et al. Economic burden of multimorbidity among older adults: impact on healthcare and societal costs. BMC Health Serv Res 2016; 16:173. https://doi.org/10.1186/s12913-016-1421-7
PMid:27160080 PMCid:PMC4862090
30. Beauducel A, Herzberg PY. On the performance of maximum likelihood versus means and variance adjusted weighted least squares estimation in CFA. Struct Equ Modeling 2006; 13:186-203. https://doi.org/10.1207/s15328007sem1302_2
31. Flora DB, Curran PJ. An empirical evaluation of alternative methods of estimation for confirmatory factor analysis with ordinal data. Psychol Methods 2004; 9:466-91. https://doi.org/10.1037/1082-989X.9.4.466
PMid:15598100 PMCid:PMC3153362
32. Muthén BO, du Toit SHC, Spisic D. Robust inference using weighted least squares and quadratic estimating equations in latent variable modeling with categorical and continuous outcomes. Technical Report, University of California, Los Angeles; 1997. Available at: https://www.statmodel.com/download/Article_075.pdf. Accessed May 5, 2020.
33. Rhemtulla M, Brosseau-Liard PÉ, Savalei V. When can categorical variables be treated as continuous? A comparison of robust continuous and categorical SEM estimation methods under suboptimal conditions. Psychol Methods 2012; 17:354-73. https://doi.org/10.1037/a0029315
PMid:22799625
34. Brown TA. Confirmatory Factor Analysis for Applied Research. New York, NY: Guilford Press, 2006.
35. Hu LT, Bentler PM. Cut off criteria for fit indexes in covariance structure analysis: conventional criteria versus new alternatives. Struct Equ Modeling 1999; 6:1-55. https://doi.org/10.1080/10705519909540118
36. Browne MW, Cudeck R. Alternative Ways of Assessing Model Fit. In: Bollen KA, Long JS, eds. Testing Structural Equation Models. Newbury Park, CA: Sage, 1993: 136-62.
37. Chisolm TH, Abrams HB, McArdle R, Wilson RH, Doyle PJ. The WHODAS II: psychometric properties in the measurement of functional health status in adults with acquired hearing loss. Trends Amplif 2005; 9:111-26. https://doi.org/10.1177/108471380500900303
PMid:16244758 PMCid:PMC4111522
38. Sousa RM, Dewey ME, Acosta D, et al. Measuring disability across cultures--the psychometric properties of the WHODAS II in older people from seven low- and middle-income countries. The 10/66 Dementia Research Group population- based survey. Int J Methods Psychiatr Res 2010; 19:1-17. https://doi.org/10.1002/mpr.299
PMid:20104493 PMCid:PMC2896722
39. Schiavolin S, Ferroli P, Acerbi F, et al. Disability in Italian neurosurgical patients: validity of the 12-item World Health Organization Disability Assessment Schedule. Int J Rehabil Res 2014; 37:267-70. https://doi.org/10.1097/MRR.0000000000000064
PMid:24802978
40. Rabin R, de Charro F. EQ-5D: a measure of health status from the EuroQol Group. Ann Med 2001; 33:337-43. https://doi.org/10.3109/07853890109002087
PMid:11491192
41. Ware JE, Snow KK, Kosinski M, Gandek B; New England Medical Center Hospital Health Institute. SF-36 health survey: manual and interpretation guide. Boston: The Health Institute, New England Medical Center, 1993.
42. Garin N, Olaya B, Moneta MV, et al. Impact of multimorbidity on disability and quality of life in the Spanish older population. PLoS One 2014; 9:e111498. https://doi.org/10.1371/journal.pone.0111498
PMid:25375890 PMCid:PMC4222819
43. Chwastiak LA, Von Korff M. Disability in depression and back pain: evaluation of the World Health Organization Disability Assessment Schedule (WHODAS II) in a primary care setting. J Clin Epidemiol 2003; 56:507-14. https://doi.org/10.1016/S0895-4356(03)00051-9
44. Kroenke K, Spitzer RL, Williams JB. The PHQ-9: validity of a brief depression severity measure. J Gen Intern Med 2001; 16:606-13. https://doi.org/10.1046/j.1525-1497.2001.016009606.x
PMid:11556941 PMCid:PMC1495268
45. Mahesh M, Abdin E, Vaingankar JA, et al. Disability in Singapore's elderly population. Ann Acad Med Singapore 2016; 45:284-96.
46. Bassett SS, Folstein MF. Cognitive impairment and functional disability in the absence of psychiatric diagnosis. Psychol Med 1991; 21:77-84. https://doi.org/10.1017/S0033291700014677
PMid:2047508
47. Moritz DJ, Kasl SV, Berkman LF. Cognitive functioning and the incidence of limitations in activities of daily living in an elderly community sample. Am J Epidemiol 1995; 141:41-9. https://doi.org/10.1093/oxfordjournals.aje.a117344
PMid:7801965
50. Downing NR, Kim JI, Williams JK, et al; PREDICT-HD Investigators and Coordinators of the Huntington Study Group. WHODAS 2.0 in prodromal Huntington disease: measures of functioning in neuropsychiatric disease. Eur J Hum Genet 2014; 22:958-63. https://doi.org/10.1038/ejhg.2013.275
PMid:24327189 PMCid:PMC4350592
52. Gaskin CJ, Happell B. On exploratory factor analysis: a review of recent evidence, an assessment of current practice, and recommendations for future use. Int J Nurs Stud 2014; 51:511-21. https://doi.org/10.1016/j.ijnurstu.2013.10.005
PMid:24183474
53. Yang Y, Xia Y. On the number of factors in exploratory factor analysis for ordered categorical data. Behav Res Methods 2015; 47:756-72. https://doi.org/10.3758/s13428-014-0499-2
PMid:24947054
54. Garrido LE, Abad FJ, Ponsoda V. Are fit indices really fit to estimate the number of factors with categorical variables? Some cautionary findings via Monte Carlo simulation. Psychol Methods 2015; 21:93-111. https://doi.org/10.1037/met0000064
PMid:26651983