

Abstract
INTRODUCTION
Injury is a significant cause of mortality and morbidity. We aimed to investigate which areas in Singapore have a significantly higher incidence of road traffic accidents (RTA) resulting in severe injuries (Tier 1), which is defined as an Injury Severity Score (ISS) greater than 15, and to develop a spatiotemporal model.
METHODS
Data was obtained from the National Trauma Registry. The RTA locations were geomapped onto the Singapore map, and spatial statistical techniques were used to identify hotspots with the Getis-Ord Gi* algorithm.
RESULTS
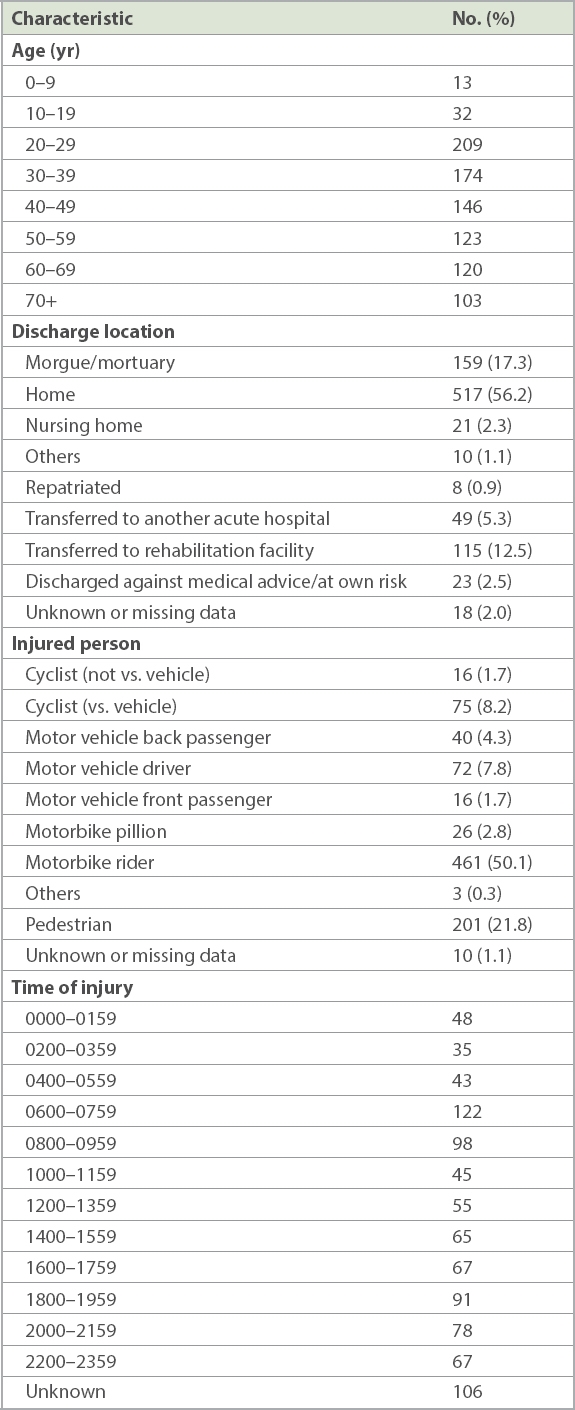
From 1 January 2013 to 31 December 2014, there were 35,673 people who were injured as a result of RTAs and 976 Tier 1 RTA victims. A total of 920 people were included in the geospatial analysis. Another 56 were involved in RTAs that did not occur within Singapore or had missing location data and thus were not included. 745 (81.0%) were discharged alive, whereas 175 (19.0%) did not survive to discharge (median ISS 38.00, interquartile range 30.00–48.00). Most of the Tier 1 RTA victims were motorcycle riders (50.1%, n = 461), pedestrians (21.8%, n = 201) and cyclists (9.9%, n = 91). The majority were male and aged 20–40 years, and there was a peak occurrence at 0600–0759 hours. Nine hotspots were identified (p < 0.01).
CONCLUSION
Information from studying hotspots of RTAs, especially those resulting in severe injuries, can be used by multiple agencies to direct resources efficiently.
INTRODUCTION
Injury is a significant cause of mortality and morbidity, especially in the younger population. In 2012, road traffic accidents (RTAs) were the ninth leading cause of death worldwide and are projected to be the seventh leading cause of death by the year 2030.(1) In Singapore, accidents, poisoning and violence was the top ICD-10 (International Statistical Classification of Diseases and Related Health Problems, tenth revision) diagnosis for hospitalisation for the year 2014.(2) RTAs are the second most common mechanism of injury in those who die from trauma in Singapore, accounting for approximately 25% of all trauma deaths in 2013.(3) An international analysis of 17 high-income countries, including Singapore, showed that the social cost of RTAs ranged from a low of 0.5% to a high of 6% (average 2.7%) of a country’s gross domestic product.(4) This economic burden is most significant, especially in the most severely injured. Even at three years post discharge, the cumulative mortality rate among RTA survivors is higher than that of the general population.(5) Recognising road safety as a major concern, the United Nations proclaimed 2011–2020 as the decade of action for road safety and unveiled a global plan towards promoting road safety.(6)
In the 1960s, Haddon developed an approach known as the Haddon Matrix that aimed to decrease morbidity and mortality in RTAs by identifying the causative factors.(7) This matrix examines the contributory causes of RTAs according to three phases (pre-event, event and post-event) and three types of possible factors (i.e. human, vehicle and environment). This matrix provides an organised framework to (a) prevent RTAs from occurring during the pre-event phase; (b) reduce injury during the injury (event phase); and (c) lessen the impact of RTAs in the post-event phase. Knowing the hotspots, or areas where there are clusters of RTAs, can help us to more efficiently direct trauma medical service resources to improve outcomes during the post-event phase and to target primary prevention interventions during the pre-event phase. This can also enable us to examine road-user patterns from available data.
Singapore has a land area of approximately 718.3 sq km (as of June 2014) and is one of the smallest countries in the world.(8) It had a population of 5,469,700 in 2014 and is very densely populated.(9) There are 3,496 km of roads and 164 km of expressways.(10)
Most of the severely injured (Tier 1) from RTAs are taken to the hospitals via Singapore Civil Defence Force (SCDF) ambulances. The emergency ambulance services in Singapore consist of 36 emergency ambulances and 10 private emergency ambulances, deployed from 16 fire stations islandwide. The ambulance-to-population ratio in Singapore is 0.9:100,000.(11) In 2011, 84.7% of cases had an ambulance response time of within 11 minutes(12) from the time of dispatch till the arrival of the ambulance to the patient. A total of seven public restructured hospitals receive trauma patients from these ambulances. Singapore has an inclusive system of trauma centres, in which most acute care hospitals receive severely injured patients. All trauma patients are sent to the nearest restructured hospital, and most do not receive prehospital triage.
The goal of this study was to investigate which areas in Singapore have a significantly higher incidence of RTAs resulting in severe injury, which is defined as an Injury Severity Score (ISS) > 15,(13) and to develop a spatiotemporal model that describes patterns of RTAs in Singapore in order to identify potential hotspots. Using the Haddon Matrix and knowledge of the hotspot locations, we ultimately aimed to decrease the incidence of RTAs and provide better care and treatment for victims. To the best of our knowledge during the time of writing, no similar hotspot analysis of RTAs in Singapore has been published; thus, this research can potentially provide valuable information.
METHODS
Ethics approval for this study was given by the SingHealth Centralised Institutional Review Board. Data from 1 January 2013 to 31 December 2014 was obtained from the National Trauma Registry (NTR). The NTR was established in 2011 and collects nationwide data on trauma in Singapore from the SCDF, the various restructured hospitals and the Health Sciences Authority. The NTR classifies the injured according to their ISS into three tiers: Tier 1 (ISS > 15), Tier 2 (ISS 9–15 [inclusive]) and Tier 3 (ISS < 9).(3) Demographics, outcome variables and the locations of the accidents of Tier 1 trauma patients, with RTAs as the primary mechanism of injury, were collected. Outcome variables included the final discharge status and location after discharge from the emergency department.
Geospatial and hotspot analysis have been done in other countries,(14-16) including developing countries, via geographic information systems and Geoweb programs or Web-based geocoding tools, which are available online at low cost and are easy to use.(17)
All known locations of RTA occurrences based on NTR data were in the form of addresses. Where possible, most of the RTAs with recorded road names also had records of building landmarks nearby. The latitude and longitude coordinates of the locations were obtained by entering the addresses or road names (i.e. pin plotting) into Google Maps.(18) These coordinates were then geomapped onto the Singapore base map via ArcGIS Desktop version 10.4 (Environmental Systems Research Institute, Redlands, CA, USA). Victims with unfilled or incompletely filled location data were excluded from the analysis. Spatial statistical techniques based on the Getis-Ord Gi*(19) algorithm were used to identify statistically significant spatial clusters with a high incidence of RTAs resulting in severe injury (ISS > 15), thus identifying hotspots. First, location coordinates were projected using a projected coordinate system. Incident data was then aggregated using the integrate function within the collect events tool. This generated an ICOUNT field, which was a collection of weighted points rather than individual incidence points. The spatial autocorrelation tool was then used to create a graph of z-scores at each distance, and the peak was used as the distance band that reflected maximum spatial correlation for the hotspot analysis. Hotspot analysis was done, and the resultant hotspots (with their p-values) were superimposed on the base map. Each of the hotspots that was statistically significant had the individual points studied to identify if any particular road had ≥ 2 RTAs.
The demographic data of the Tier 1 injured was analysed to characterise at-risk groups. As it was noted that the ISS might not be normally distributed in some registries,(20) including our study population, comparisons of median ISS were done via the independent samples Mann-Whitney U test or, if applicable, the independent samples Kruskal-Wallis test. All statistical analysis was done using IBM SPSS Statistics version 23.0 (IBM Corp, Armonk, NY, USA).
RESULTS
From 1 January 2013 to 31 December 2014, a total of 35,673 people were injured as a result of RTAs. There were 976 RTA victims in Tier 1 (ISS > 15), 1,431 in Tier 2 and 33,266 in Tier 3. The Tier 1 victims had a median ISS of 25.00 (interquartile range [IQR] 19.00–30.00). 56 (5.7%) Tier 1 victims had RTAs that had not occurred within Singapore or had missing location data and thus were not included in the geospatial analysis. Out of the 920 remaining Tier 1 patients, 745 (81.0%) were discharged alive with a median ISS of 22.00 (IQR 17.00–26.00), whereas 175 (19.0%) did not survive to discharge (median ISS 38.00, IQR [30.00–48.00]). There was a statistical difference between the median ISS of those who survived to discharge and that of those who died (p ≤ 0.001).
The characteristics of the 920 victims are shown in
Table I
Description of Tier 1 victims (n = 920).
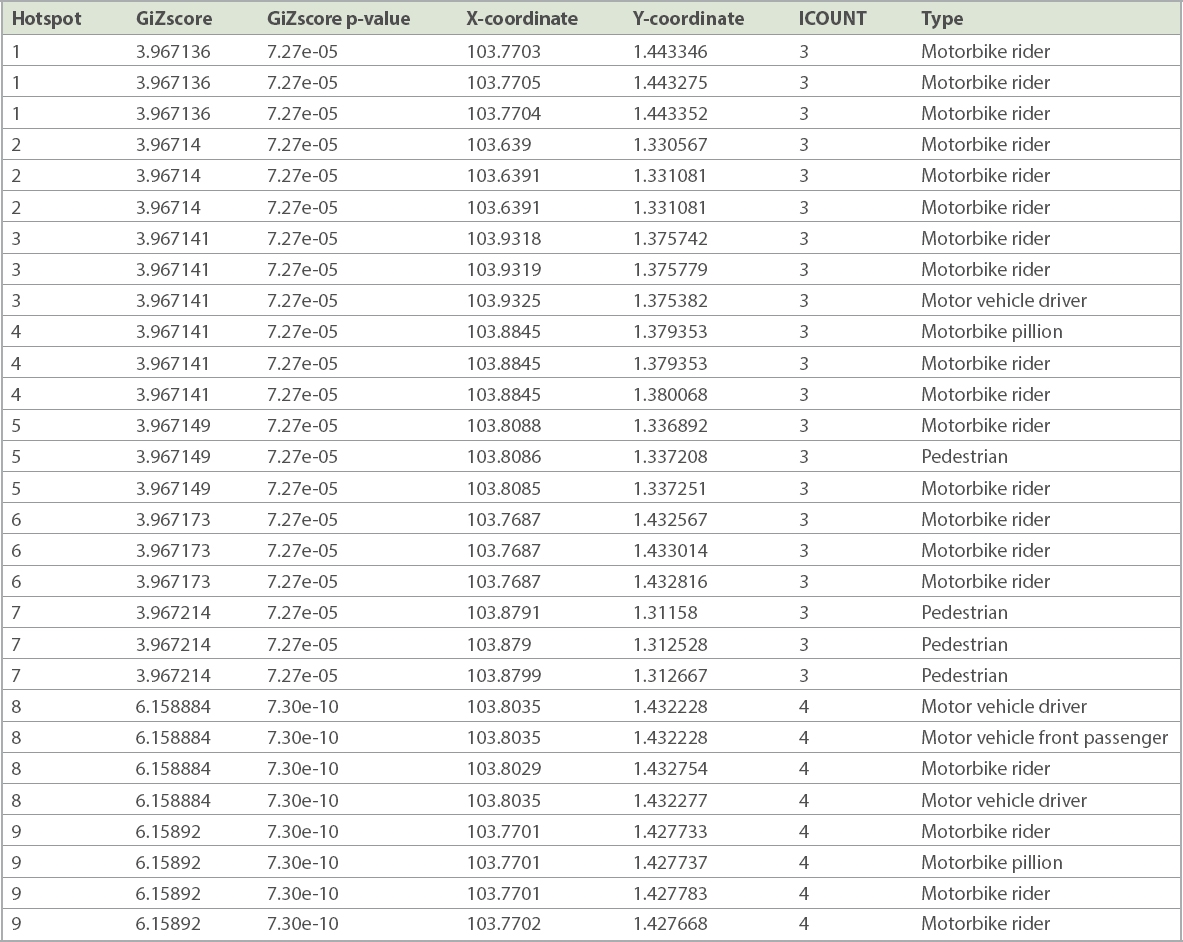
After geomapping all 920 coordinates of RTA locations that had ≥ 1 person with severe injuries, nine statistically significant hotspots were generated. All hotspots had a confidence level greater than 99% (p < 0.01) (
Fig. 1
Diagram shows hotspots of road traffic accidents (RTAs) in Singapore.
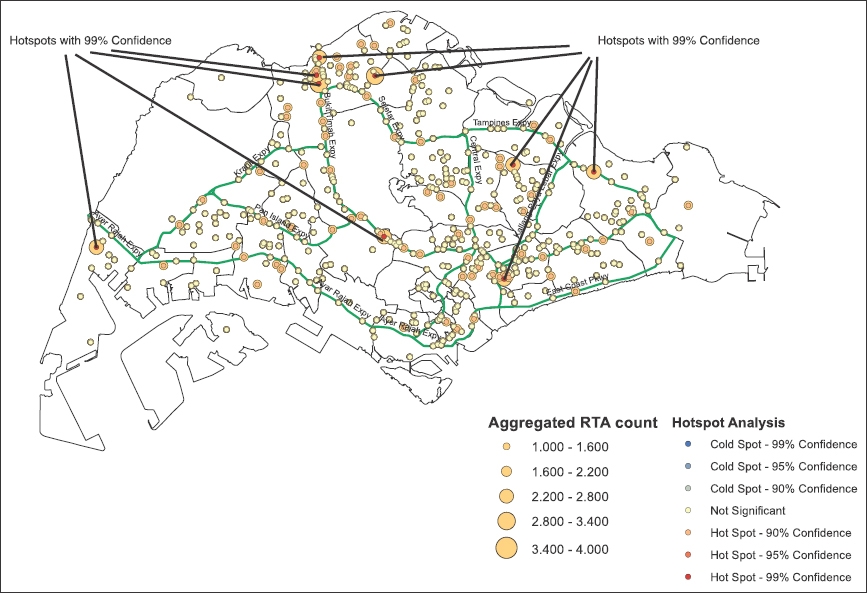
Table II
Hotspot data.
The hotspots were studied for location and geographic proximity. There was a distinct cluster of hotspots around the Woodlands area (
DISCUSSION
In this study, the injured RTA victims in Tier 1 tended to be young, male and from the most economically productive age group. One reason for this finding could be the higher risk appetite of road users in this group. This reflects global trends(1,21-24) and further illustrates the burden of injury as a disease. It should also be recognised that the elderly are particularly susceptible to RTAs, possibly due to impaired judgement, reduced reflexes and mobility. This elderly group will become more significant as Singapore, like many other developed countries, experiences a greying population.(25) As such, traffic safety measures and policies, together with any changes in the trauma system, must take this group into consideration.
As expected, the injured who did not survive to discharge from hospital had a higher median ISS compared to the survivors. Notably, there were two peak timings for RTAs with Tier 1 victims, between 0600 hours and 0959 hours as well as between 1800 hours and 1959 hours. This is likely due to peak hour traffic with a large number of motorists and pedestrians going to their workplaces or returning home.
The World Health Organization’s Global Status Report on Road Safety 2015 noted that almost half of the deaths on the road were among motorcyclist, cyclists and pedestrians,(26) who are known to be ‘vulnerable’ road users. Similarly, in Singapore, most of the Tier 1 injured belonged to this ‘vulnerable’ group. Furthermore, it was interesting to note that Geylang Road had a disproportionately high incidence of pedestrians becoming severely injured. This particular road should be studied in further detail and protective measures instituted for pedestrians.
Legislation can help to decrease the incidence of RTAs, mainly as a form of deterrence. Although Singapore has strict laws regarding speeding, drunk driving, seatbelts, helmets and child restraints, enforcement can be enhanced with the help of the traffic police along the roads and areas that correspond to the hotspots. This may help to mitigate the human factors in the pre-event and event phases of Haddon’s Matrix. Road safety specialists from the Land Transport Authority can help to investigate and introduce ways to improve the environmental factors for the pre-event and event phases to promote road safety along the roads of concern. Road signs warning of high-risk areas may help increase awareness and caution among motorists and pedestrians.
Education plays a crucial role in addressing human factors in all phases of the Haddon Matrix. Incorporating the concept of road safety into school curriculum for children can create road safety awareness, correct attitudes and encourage appropriate behaviour on the roads. The mainstream media in Singapore can also play a greater role in public education on trauma and RTAs.(27) Social media has, in recent years, begun to emerge as a powerful tool in education and generating public interest, and its importance cannot be ignored.
A good knowledge of where the hotspots are can guide efforts to decrease both the response time of SCDF ambulances and the time taken to transport the injured to a trauma centre. Despatch centres could be located near these hotspots and be adequately staffed and allocated with optimal prehospital medical resources. The quicker the response of the ambulances, the sooner the patient can arrive at the trauma centre where time-sensitive and potentially life-saving procedures can be performed. On a similar note, the hospitals or trauma centres that receive major trauma cases should also take these hotspots into account and allocate resources accordingly. Based on the location of the hospitals in Singapore and their proximity to the hotspots, Khoo Teck Puat Hospital is likely to receive many Tier 1 RTA victims.
There were some limitations to the study. Only the Tier 1 injured were studied and analysed. This may not give a complete picture, and it is debatable whether the results can be generalised to all RTAs in Singapore. However, it is also likely that Tier 1 patients are a surrogate for patients in the lower tiers, and since Tier 1 patients tend to have higher impact in terms of socioeconomic burden and resource demand, it may be more crucial to focus efforts on this group. Furthermore, Tier 1 patients were selected for the study because their data integrity was better, and they required more resources and had higher mortality and morbidity. Additionally, the study mainly examined Tier 1 RTA victims and not the RTA itself as an event. However, it is unlikely that this would have made a significant difference to the analysis, as our data analysis showed that there were only five RTAs in 2013 that had more than one Tier 1 victim, all of which had only two Tier 1 victims. Another limitation of hotspot analysis for RTAs is that hotspots are determined via distance and do not take into account how roads run (i.e. hotspots are purely directional, whereas roads can be linear, circular or zigzag). Thus, it may not be apparent which roads have a high incidence rate of RTAs based on the hotspots alone.
During the study, we noted that information on the location of the RTAs was not as complete as expected. Although the location data was complete in 88.4% of the victims, the completion rate of the location data was much lower in the lower tiers. Although the Singapore Traffic Police may collect accurate information on the locations of RTAs, this information is not shared by the police nor collected by the NTR. The Traffic Police also does not have data on the outcomes of the victims or information on the severity of the injuries sustained. One assumption made in this study was that the severely injured would not have been moved from the location of the RTA and, thus, the location where the victim was picked up as recorded by the SCDF paramedics would likely be the site of the RTA. However, it would be ideal if we could match and analyse the location data collected by the Traffic Police with patient injury and outcome data from the NTR.
To our knowledge, this study is the first in Singapore that aimed to provide information regarding the geospatial distribution and relationship of RTAs with Tier 1 victims. This information can guide and focus the efforts of the relevant authorities to ensure effective and efficient use of resources. Considering the importance of keeping and using accurate location records, direct recording of the location of RTA incidents can be done via Global Positioning System devices. A geodatabase can then be set up, and any data collected submitted to the NTR. The methodology and framework used in this study can be applied to a larger-scale future study involving all tiers of RTAs or other forms of trauma such as falls. To take this even further, similar geospatial analysis can be done for other medical conditions that require resources from multiple agencies, such as out-of-hospital cardiac arrests.
In conclusion, road safety, prevention of RTAs, treatment and eventual rehabilitation of RTA victims require much coordinated effort from multiple agencies. Law enforcement, land and road safety professionals, prehospital EAS, trauma centres, and rehabilitation facilities are all important links in this chain. Through the study of hotspots of traumatic events, especially those resulting in severe injuries, information can be collected and used by multiple agencies to direct their efforts and resources. Based on our study findings, we recommend that preventive measures be employed along the Bukit Timah Expressway just north of the Seletar Expressway, as there are three hotspots there. Similarly, Geylang Road should have preventive measures in place, given the higher incidence of severely injured pedestrians. Khoo Teck Puat Hospital would be the receiving hospital for many of the hotspots if we continue using an inclusive trauma system. A good geodatabase can help other similar studies to better understand the trauma from road traffic accidents in Singapore.